Chickasaw vs Immigrants from Spain Median Family Income
COMPARE
Chickasaw
Immigrants from Spain
Median Family Income
Median Family Income Comparison
Chickasaw
Immigrants from Spain
$85,356
MEDIAN FAMILY INCOME
0.0/ 100
METRIC RATING
307th/ 347
METRIC RANK
$113,815
MEDIAN FAMILY INCOME
99.7/ 100
METRIC RATING
67th/ 347
METRIC RANK
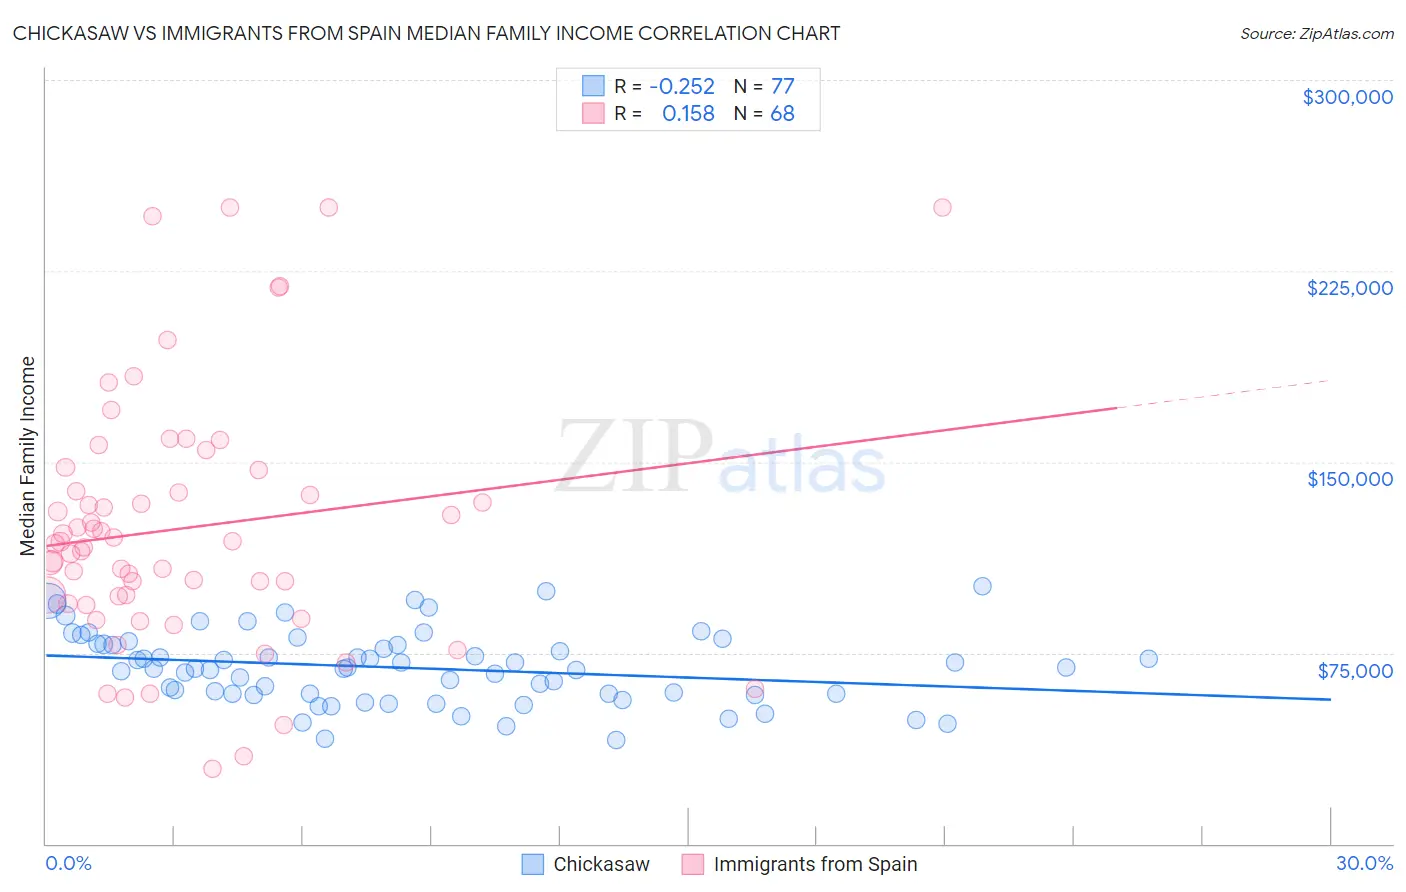
Chickasaw vs Immigrants from Spain Median Family Income Correlation Chart
The statistical analysis conducted on geographies consisting of 147,660,168 people shows a weak negative correlation between the proportion of Chickasaw and median family income in the United States with a correlation coefficient (R) of -0.252 and weighted average of $85,356. Similarly, the statistical analysis conducted on geographies consisting of 239,551,632 people shows a poor positive correlation between the proportion of Immigrants from Spain and median family income in the United States with a correlation coefficient (R) of 0.158 and weighted average of $113,815, a difference of 33.3%.
Median Family Income Correlation Summary
| Measurement | Chickasaw | Immigrants from Spain |
| Minimum | $40,774 | $29,286 |
| Maximum | $101,302 | $250,001 |
| Range | $60,528 | $220,715 |
| Mean | $69,119 | $124,049 |
| Median | $68,772 | $118,215 |
| Interquartile 25% (IQ1) | $58,750 | $95,635 |
| Interquartile 75% (IQ3) | $78,533 | $142,548 |
| Interquartile Range (IQR) | $19,783 | $46,913 |
| Standard Deviation (Sample) | $14,096 | $49,625 |
| Standard Deviation (Population) | $14,004 | $49,259 |
Similar Demographics by Median Family Income
Demographics Similar to Chickasaw by Median Family Income
In terms of median family income, the demographic groups most similar to Chickasaw are Immigrants from Dominica ($85,411, a difference of 0.060%), Paiute ($85,414, a difference of 0.070%), U.S. Virgin Islander ($85,294, a difference of 0.070%), Haitian ($85,218, a difference of 0.16%), and Mexican ($85,618, a difference of 0.31%).
| Demographics | Rating | Rank | Median Family Income |
| Ottawa | 0.0 /100 | #300 | Tragic $86,380 |
| Colville | 0.0 /100 | #301 | Tragic $85,792 |
| Spanish American Indians | 0.0 /100 | #302 | Tragic $85,728 |
| Hispanics or Latinos | 0.0 /100 | #303 | Tragic $85,647 |
| Mexicans | 0.0 /100 | #304 | Tragic $85,618 |
| Paiute | 0.0 /100 | #305 | Tragic $85,414 |
| Immigrants | Dominica | 0.0 /100 | #306 | Tragic $85,411 |
| Chickasaw | 0.0 /100 | #307 | Tragic $85,356 |
| U.S. Virgin Islanders | 0.0 /100 | #308 | Tragic $85,294 |
| Haitians | 0.0 /100 | #309 | Tragic $85,218 |
| Immigrants | Central America | 0.0 /100 | #310 | Tragic $85,050 |
| Hondurans | 0.0 /100 | #311 | Tragic $85,004 |
| Cubans | 0.0 /100 | #312 | Tragic $84,981 |
| Choctaw | 0.0 /100 | #313 | Tragic $84,835 |
| Immigrants | Bahamas | 0.0 /100 | #314 | Tragic $84,732 |
Demographics Similar to Immigrants from Spain by Median Family Income
In terms of median family income, the demographic groups most similar to Immigrants from Spain are Paraguayan ($114,016, a difference of 0.18%), Egyptian ($114,119, a difference of 0.27%), Immigrants from Serbia ($113,463, a difference of 0.31%), Immigrants from Bulgaria ($113,461, a difference of 0.31%), and Immigrants from Romania ($113,434, a difference of 0.34%).
| Demographics | Rating | Rank | Median Family Income |
| Immigrants | Latvia | 99.8 /100 | #60 | Exceptional $114,826 |
| Immigrants | Belarus | 99.8 /100 | #61 | Exceptional $114,586 |
| Mongolians | 99.8 /100 | #62 | Exceptional $114,553 |
| Immigrants | Pakistan | 99.8 /100 | #63 | Exceptional $114,406 |
| Immigrants | Scotland | 99.7 /100 | #64 | Exceptional $114,392 |
| Egyptians | 99.7 /100 | #65 | Exceptional $114,119 |
| Paraguayans | 99.7 /100 | #66 | Exceptional $114,016 |
| Immigrants | Spain | 99.7 /100 | #67 | Exceptional $113,815 |
| Immigrants | Serbia | 99.6 /100 | #68 | Exceptional $113,463 |
| Immigrants | Bulgaria | 99.6 /100 | #69 | Exceptional $113,461 |
| Immigrants | Romania | 99.6 /100 | #70 | Exceptional $113,434 |
| South Africans | 99.5 /100 | #71 | Exceptional $113,229 |
| Afghans | 99.5 /100 | #72 | Exceptional $112,971 |
| Laotians | 99.5 /100 | #73 | Exceptional $112,859 |
| Immigrants | Italy | 99.4 /100 | #74 | Exceptional $112,848 |