Cheyenne vs Bermudan Unemployment Among Ages 25 to 29 years
COMPARE
Cheyenne
Bermudan
Unemployment Among Ages 25 to 29 years
Unemployment Among Ages 25 to 29 years Comparison
Cheyenne
Bermudans
11.8%
UNEMPLOYMENT AMONG AGES 25 TO 29 YEARS
0.0/ 100
METRIC RATING
340th/ 347
METRIC RANK
7.0%
UNEMPLOYMENT AMONG AGES 25 TO 29 YEARS
3.8/ 100
METRIC RATING
229th/ 347
METRIC RANK
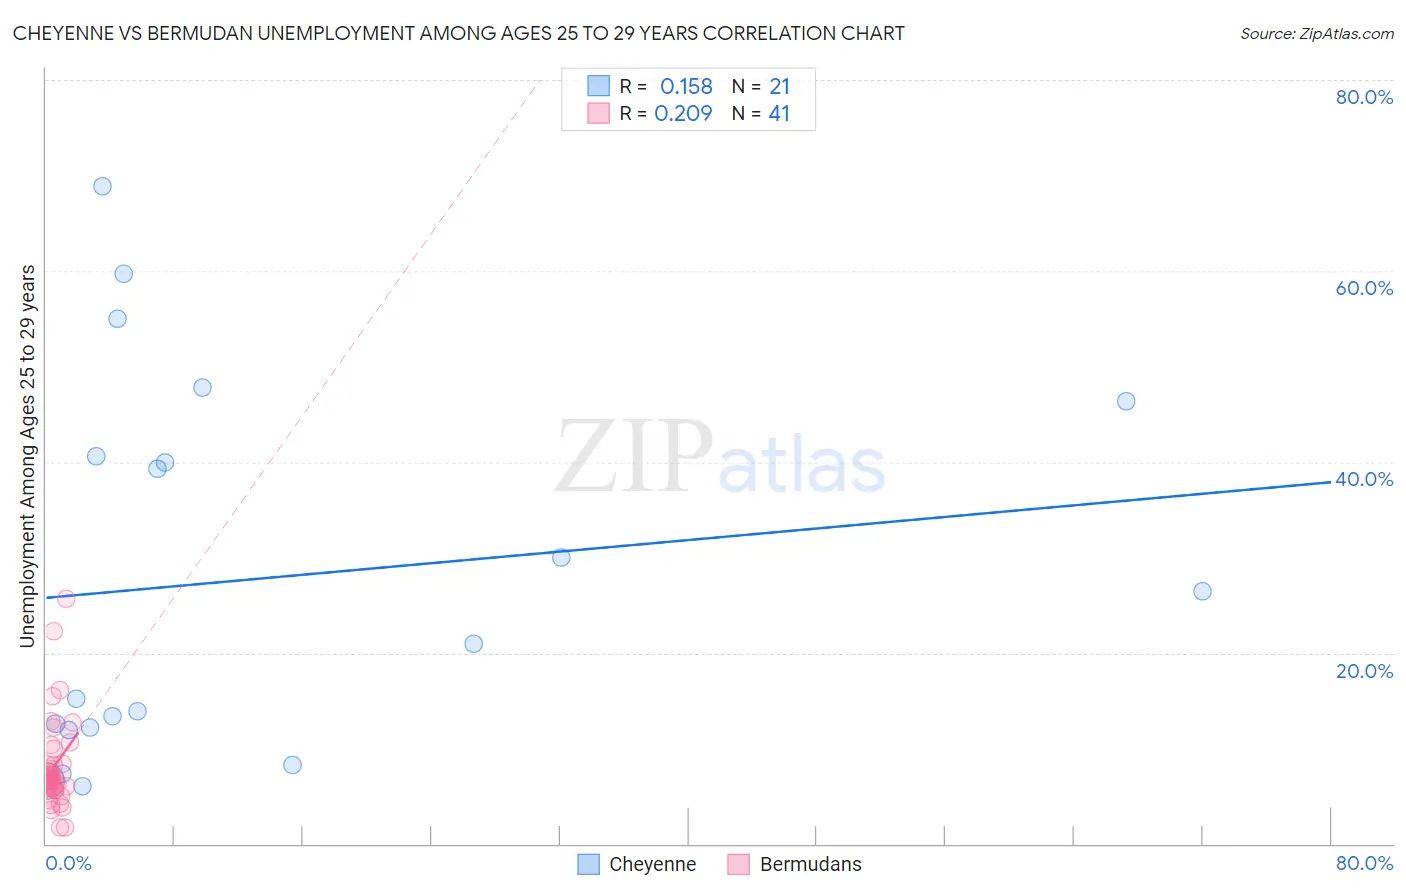
Cheyenne vs Bermudan Unemployment Among Ages 25 to 29 years Correlation Chart
The statistical analysis conducted on geographies consisting of 79,166,796 people shows a poor positive correlation between the proportion of Cheyenne and unemployment rate among population between the ages 25 and 29 in the United States with a correlation coefficient (R) of 0.158 and weighted average of 11.8%. Similarly, the statistical analysis conducted on geographies consisting of 55,384,018 people shows a weak positive correlation between the proportion of Bermudans and unemployment rate among population between the ages 25 and 29 in the United States with a correlation coefficient (R) of 0.209 and weighted average of 7.0%, a difference of 69.5%.
Unemployment Among Ages 25 to 29 years Correlation Summary
| Measurement | Cheyenne | Bermudan |
| Minimum | 6.0% | 1.7% |
| Maximum | 68.9% | 25.7% |
| Range | 62.9% | 24.0% |
| Mean | 27.7% | 8.1% |
| Median | 20.9% | 6.9% |
| Interquartile 25% (IQ1) | 12.1% | 5.8% |
| Interquartile 75% (IQ3) | 43.5% | 9.2% |
| Interquartile Range (IQR) | 31.4% | 3.4% |
| Standard Deviation (Sample) | 19.6% | 4.8% |
| Standard Deviation (Population) | 19.2% | 4.8% |
Similar Demographics by Unemployment Among Ages 25 to 29 years
Demographics Similar to Cheyenne by Unemployment Among Ages 25 to 29 years
In terms of unemployment among ages 25 to 29 years, the demographic groups most similar to Cheyenne are Pima (11.8%, a difference of 0.42%), Sioux (11.7%, a difference of 1.4%), Tohono O'odham (12.1%, a difference of 2.1%), Navajo (12.2%, a difference of 2.9%), and Menominee (11.3%, a difference of 4.9%).
| Demographics | Rating | Rank | Unemployment Among Ages 25 to 29 years |
| Alaskan Athabascans | 0.0 /100 | #333 | Tragic 10.8% |
| Yuman | 0.0 /100 | #334 | Tragic 11.0% |
| Puerto Ricans | 0.0 /100 | #335 | Tragic 11.1% |
| Lumbee | 0.0 /100 | #336 | Tragic 11.2% |
| Menominee | 0.0 /100 | #337 | Tragic 11.3% |
| Sioux | 0.0 /100 | #338 | Tragic 11.7% |
| Pima | 0.0 /100 | #339 | Tragic 11.8% |
| Cheyenne | 0.0 /100 | #340 | Tragic 11.8% |
| Tohono O'odham | 0.0 /100 | #341 | Tragic 12.1% |
| Navajo | 0.0 /100 | #342 | Tragic 12.2% |
| Inupiat | 0.0 /100 | #343 | Tragic 13.4% |
| Hopi | 0.0 /100 | #344 | Tragic 13.5% |
| Arapaho | 0.0 /100 | #345 | Tragic 15.4% |
| Crow | 0.0 /100 | #346 | Tragic 15.4% |
| Yup'ik | 0.0 /100 | #347 | Tragic 17.9% |
Demographics Similar to Bermudans by Unemployment Among Ages 25 to 29 years
In terms of unemployment among ages 25 to 29 years, the demographic groups most similar to Bermudans are Immigrants from El Salvador (7.0%, a difference of 0.080%), Immigrants from Panama (7.0%, a difference of 0.15%), Salvadoran (7.0%, a difference of 0.21%), Immigrants from Liberia (7.0%, a difference of 0.34%), and Central American (7.0%, a difference of 0.37%).
| Demographics | Rating | Rank | Unemployment Among Ages 25 to 29 years |
| Spaniards | 7.7 /100 | #222 | Tragic 6.9% |
| Celtics | 7.6 /100 | #223 | Tragic 6.9% |
| Immigrants | Immigrants | 6.2 /100 | #224 | Tragic 6.9% |
| Japanese | 5.4 /100 | #225 | Tragic 6.9% |
| Immigrants | Liberia | 4.8 /100 | #226 | Tragic 7.0% |
| Salvadorans | 4.4 /100 | #227 | Tragic 7.0% |
| Immigrants | Panama | 4.2 /100 | #228 | Tragic 7.0% |
| Bermudans | 3.8 /100 | #229 | Tragic 7.0% |
| Immigrants | El Salvador | 3.6 /100 | #230 | Tragic 7.0% |
| Central Americans | 3.0 /100 | #231 | Tragic 7.0% |
| Spanish Americans | 2.7 /100 | #232 | Tragic 7.0% |
| Immigrants | Honduras | 2.4 /100 | #233 | Tragic 7.0% |
| French Canadians | 2.4 /100 | #234 | Tragic 7.0% |
| Panamanians | 2.1 /100 | #235 | Tragic 7.0% |
| Cape Verdeans | 1.9 /100 | #236 | Tragic 7.0% |