Cheyenne vs Bermudan 6th Grade
COMPARE
Cheyenne
Bermudan
6th Grade
6th Grade Comparison
Cheyenne
Bermudans
97.5%
6TH GRADE
97.9/ 100
METRIC RATING
105th/ 347
METRIC RANK
97.1%
6TH GRADE
52.6/ 100
METRIC RATING
169th/ 347
METRIC RANK
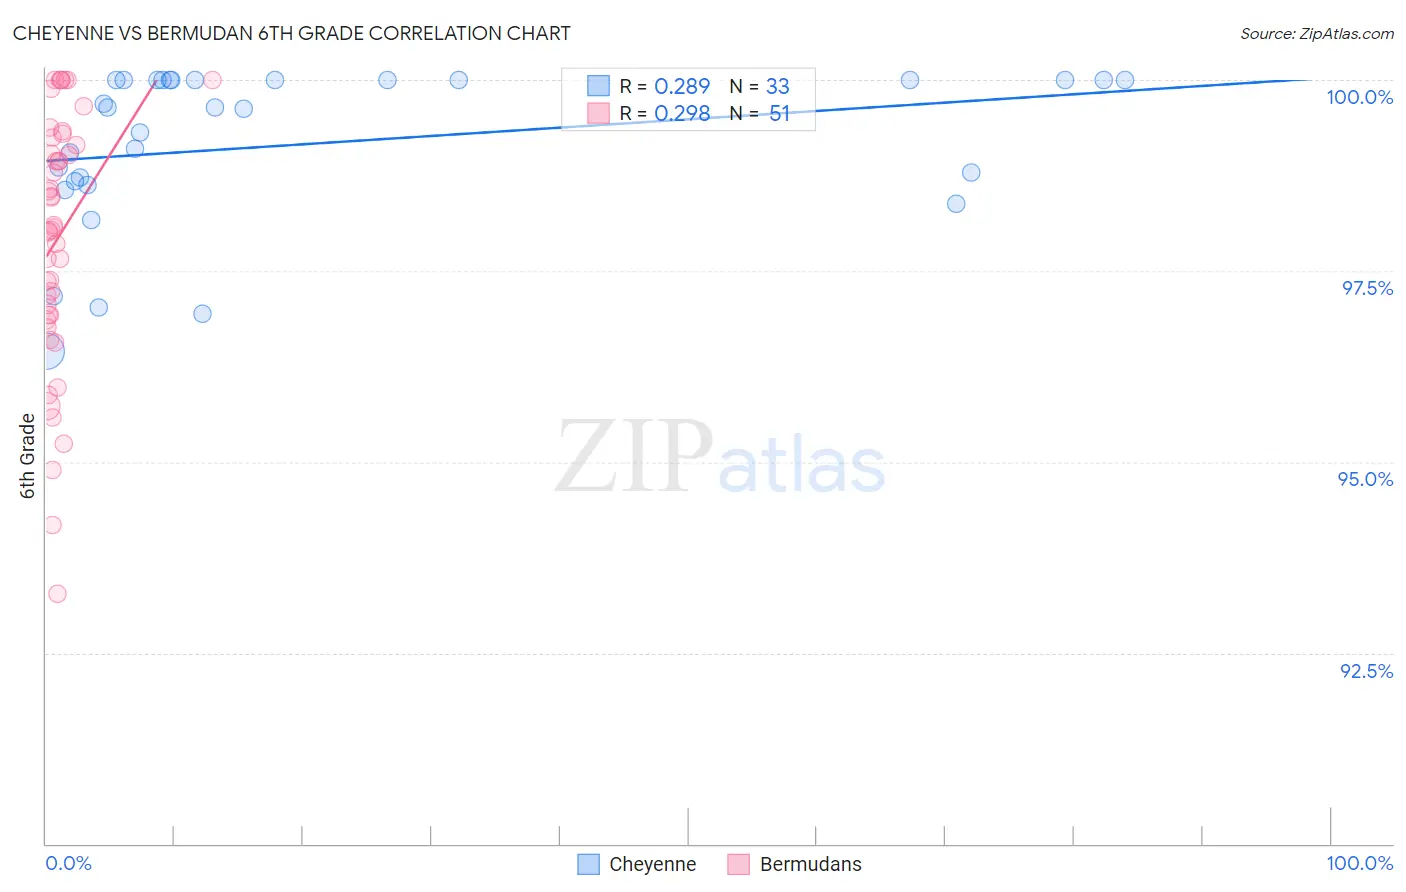
Cheyenne vs Bermudan 6th Grade Correlation Chart
The statistical analysis conducted on geographies consisting of 80,716,760 people shows a weak positive correlation between the proportion of Cheyenne and percentage of population with at least 6th grade education in the United States with a correlation coefficient (R) of 0.289 and weighted average of 97.5%. Similarly, the statistical analysis conducted on geographies consisting of 55,721,975 people shows a weak positive correlation between the proportion of Bermudans and percentage of population with at least 6th grade education in the United States with a correlation coefficient (R) of 0.298 and weighted average of 97.1%, a difference of 0.43%.
6th Grade Correlation Summary
| Measurement | Cheyenne | Bermudan |
| Minimum | 96.5% | 93.3% |
| Maximum | 100.0% | 100.0% |
| Range | 3.5% | 6.7% |
| Mean | 99.2% | 97.9% |
| Median | 99.6% | 98.1% |
| Interquartile 25% (IQ1) | 98.7% | 96.9% |
| Interquartile 75% (IQ3) | 100.0% | 99.2% |
| Interquartile Range (IQR) | 1.3% | 2.3% |
| Standard Deviation (Sample) | 1.0% | 1.6% |
| Standard Deviation (Population) | 1.0% | 1.6% |
Similar Demographics by 6th Grade
Demographics Similar to Cheyenne by 6th Grade
In terms of 6th grade, the demographic groups most similar to Cheyenne are Bhutanese (97.5%, a difference of 0.0%), German Russian (97.5%, a difference of 0.0%), Choctaw (97.5%, a difference of 0.010%), Menominee (97.5%, a difference of 0.010%), and Turkish (97.5%, a difference of 0.020%).
| Demographics | Rating | Rank | 6th Grade |
| Immigrants | Denmark | 98.5 /100 | #98 | Exceptional 97.5% |
| Yugoslavians | 98.5 /100 | #99 | Exceptional 97.5% |
| Turks | 98.3 /100 | #100 | Exceptional 97.5% |
| South Africans | 98.2 /100 | #101 | Exceptional 97.5% |
| Choctaw | 98.0 /100 | #102 | Exceptional 97.5% |
| Bhutanese | 98.0 /100 | #103 | Exceptional 97.5% |
| German Russians | 97.9 /100 | #104 | Exceptional 97.5% |
| Cheyenne | 97.9 /100 | #105 | Exceptional 97.5% |
| Menominee | 97.7 /100 | #106 | Exceptional 97.5% |
| Immigrants | Singapore | 97.6 /100 | #107 | Exceptional 97.5% |
| Immigrants | Nonimmigrants | 97.3 /100 | #108 | Exceptional 97.4% |
| Immigrants | Czechoslovakia | 97.3 /100 | #109 | Exceptional 97.4% |
| Thais | 96.9 /100 | #110 | Exceptional 97.4% |
| Iroquois | 96.9 /100 | #111 | Exceptional 97.4% |
| Immigrants | Latvia | 96.7 /100 | #112 | Exceptional 97.4% |
Demographics Similar to Bermudans by 6th Grade
In terms of 6th grade, the demographic groups most similar to Bermudans are Apache (97.1%, a difference of 0.0%), Immigrants from Taiwan (97.1%, a difference of 0.0%), Chilean (97.1%, a difference of 0.0%), Immigrants from Sri Lanka (97.1%, a difference of 0.0%), and Immigrants from Italy (97.1%, a difference of 0.010%).
| Demographics | Rating | Rank | 6th Grade |
| Marshallese | 60.2 /100 | #162 | Good 97.1% |
| Albanians | 57.8 /100 | #163 | Average 97.1% |
| Immigrants | Korea | 57.7 /100 | #164 | Average 97.1% |
| Immigrants | Poland | 56.2 /100 | #165 | Average 97.1% |
| Immigrants | Italy | 53.8 /100 | #166 | Average 97.1% |
| Apache | 53.6 /100 | #167 | Average 97.1% |
| Immigrants | Taiwan | 53.5 /100 | #168 | Average 97.1% |
| Bermudans | 52.6 /100 | #169 | Average 97.1% |
| Chileans | 52.1 /100 | #170 | Average 97.1% |
| Immigrants | Sri Lanka | 51.7 /100 | #171 | Average 97.1% |
| Egyptians | 50.9 /100 | #172 | Average 97.1% |
| Arabs | 50.1 /100 | #173 | Average 97.0% |
| Venezuelans | 50.0 /100 | #174 | Average 97.0% |
| Immigrants | Kazakhstan | 47.3 /100 | #175 | Average 97.0% |
| Immigrants | Micronesia | 47.1 /100 | #176 | Average 97.0% |