Cheyenne vs Bermudan 3 or more Vehicles in Household
COMPARE
Cheyenne
Bermudan
3 or more Vehicles in Household
3 or more Vehicles in Household Comparison
Cheyenne
Bermudans
22.7%
3 OR MORE VEHICLES IN HOUSEHOLD
100.0/ 100
METRIC RATING
44th/ 347
METRIC RANK
17.8%
3 OR MORE VEHICLES IN HOUSEHOLD
0.9/ 100
METRIC RATING
263rd/ 347
METRIC RANK
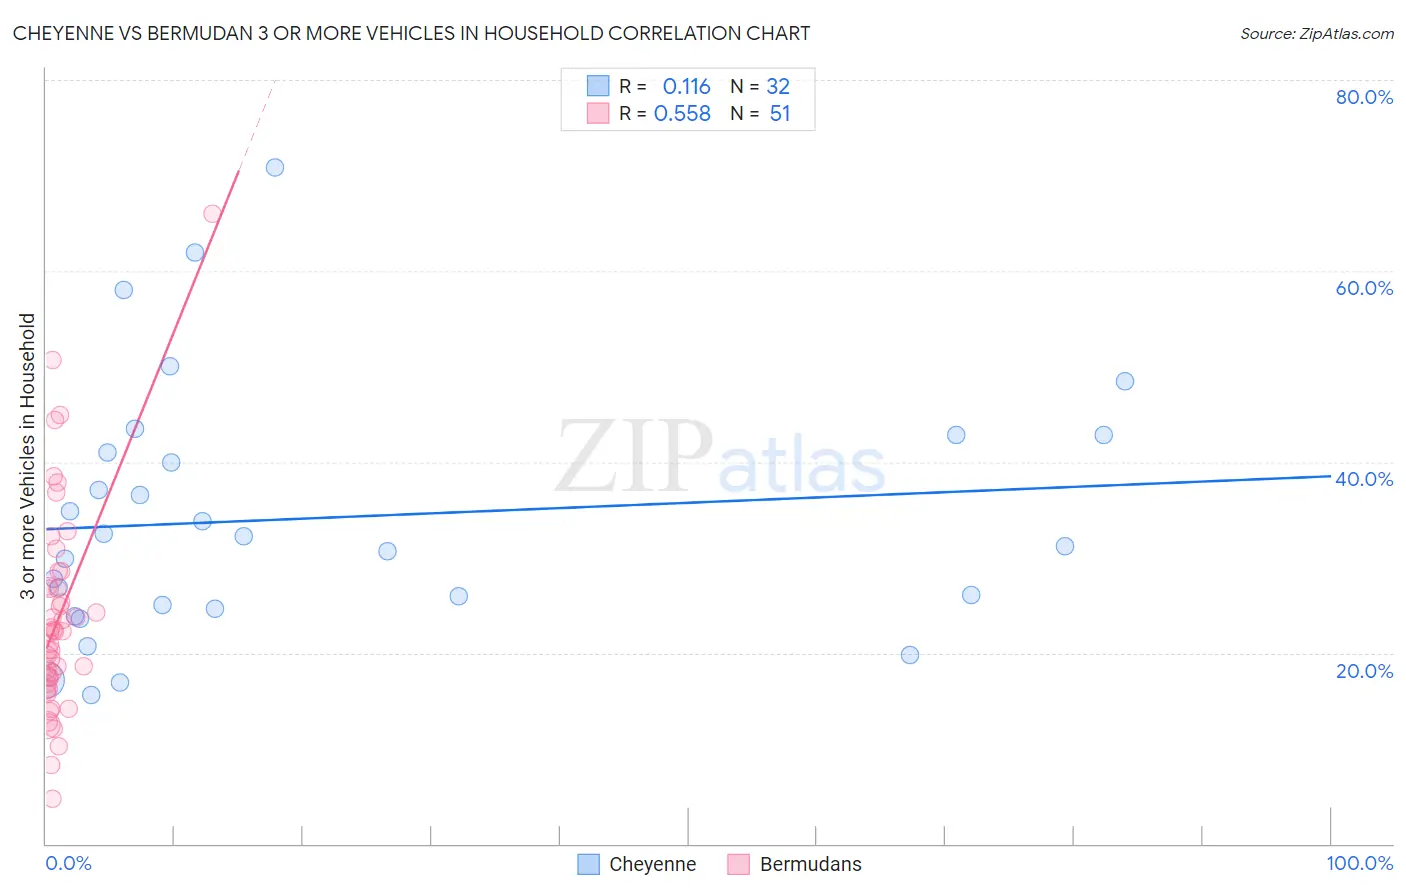
Cheyenne vs Bermudan 3 or more Vehicles in Household Correlation Chart
The statistical analysis conducted on geographies consisting of 80,705,917 people shows a poor positive correlation between the proportion of Cheyenne and percentage of households with 3 or more vehicles available in the United States with a correlation coefficient (R) of 0.116 and weighted average of 22.7%. Similarly, the statistical analysis conducted on geographies consisting of 55,710,520 people shows a substantial positive correlation between the proportion of Bermudans and percentage of households with 3 or more vehicles available in the United States with a correlation coefficient (R) of 0.558 and weighted average of 17.8%, a difference of 27.8%.
3 or more Vehicles in Household Correlation Summary
| Measurement | Cheyenne | Bermudan |
| Minimum | 15.6% | 4.8% |
| Maximum | 70.8% | 66.0% |
| Range | 55.2% | 61.2% |
| Mean | 34.1% | 23.6% |
| Median | 31.7% | 22.1% |
| Interquartile 25% (IQ1) | 24.8% | 16.7% |
| Interquartile 75% (IQ3) | 41.9% | 27.0% |
| Interquartile Range (IQR) | 17.1% | 10.3% |
| Standard Deviation (Sample) | 13.3% | 11.2% |
| Standard Deviation (Population) | 13.1% | 11.1% |
Similar Demographics by 3 or more Vehicles in Household
Demographics Similar to Cheyenne by 3 or more Vehicles in Household
In terms of 3 or more vehicles in household, the demographic groups most similar to Cheyenne are Ute (22.7%, a difference of 0.10%), Osage (22.7%, a difference of 0.13%), German (22.7%, a difference of 0.25%), Native/Alaskan (22.7%, a difference of 0.25%), and American (22.6%, a difference of 0.29%).
| Demographics | Rating | Rank | 3 or more Vehicles in Household |
| Swedes | 100.0 /100 | #37 | Exceptional 23.0% |
| Dutch | 100.0 /100 | #38 | Exceptional 22.9% |
| Yaqui | 100.0 /100 | #39 | Exceptional 22.9% |
| Europeans | 100.0 /100 | #40 | Exceptional 22.9% |
| Germans | 100.0 /100 | #41 | Exceptional 22.7% |
| Natives/Alaskans | 100.0 /100 | #42 | Exceptional 22.7% |
| Osage | 100.0 /100 | #43 | Exceptional 22.7% |
| Cheyenne | 100.0 /100 | #44 | Exceptional 22.7% |
| Ute | 100.0 /100 | #45 | Exceptional 22.7% |
| Americans | 100.0 /100 | #46 | Exceptional 22.6% |
| Malaysians | 100.0 /100 | #47 | Exceptional 22.6% |
| Scottish | 100.0 /100 | #48 | Exceptional 22.6% |
| Scotch-Irish | 100.0 /100 | #49 | Exceptional 22.6% |
| Sioux | 100.0 /100 | #50 | Exceptional 22.6% |
| Whites/Caucasians | 100.0 /100 | #51 | Exceptional 22.6% |
Demographics Similar to Bermudans by 3 or more Vehicles in Household
In terms of 3 or more vehicles in household, the demographic groups most similar to Bermudans are Cambodian (17.8%, a difference of 0.030%), Colombian (17.8%, a difference of 0.11%), Immigrants from Northern Africa (17.8%, a difference of 0.14%), Ugandan (17.8%, a difference of 0.16%), and Immigrants from Panama (17.7%, a difference of 0.16%).
| Demographics | Rating | Rank | 3 or more Vehicles in Household |
| Sub-Saharan Africans | 1.1 /100 | #256 | Tragic 17.9% |
| Immigrants | Eritrea | 1.1 /100 | #257 | Tragic 17.8% |
| Sudanese | 1.1 /100 | #258 | Tragic 17.8% |
| Uruguayans | 1.0 /100 | #259 | Tragic 17.8% |
| Ugandans | 0.9 /100 | #260 | Tragic 17.8% |
| Immigrants | Northern Africa | 0.9 /100 | #261 | Tragic 17.8% |
| Colombians | 0.9 /100 | #262 | Tragic 17.8% |
| Bermudans | 0.9 /100 | #263 | Tragic 17.8% |
| Cambodians | 0.9 /100 | #264 | Tragic 17.8% |
| Immigrants | Panama | 0.8 /100 | #265 | Tragic 17.7% |
| Macedonians | 0.8 /100 | #266 | Tragic 17.7% |
| Immigrants | Venezuela | 0.8 /100 | #267 | Tragic 17.7% |
| Immigrants | Bulgaria | 0.8 /100 | #268 | Tragic 17.7% |
| Immigrants | France | 0.6 /100 | #269 | Tragic 17.6% |
| Immigrants | Nepal | 0.6 /100 | #270 | Tragic 17.6% |