Cheyenne vs Creek No Vehicles in Household
COMPARE
Cheyenne
Creek
No Vehicles in Household
No Vehicles in Household Comparison
Cheyenne
Creek
11.7%
NO VEHICLES IN HOUSEHOLD
2.4/ 100
METRIC RATING
243rd/ 347
METRIC RANK
7.8%
NO VEHICLES IN HOUSEHOLD
99.9/ 100
METRIC RATING
38th/ 347
METRIC RANK
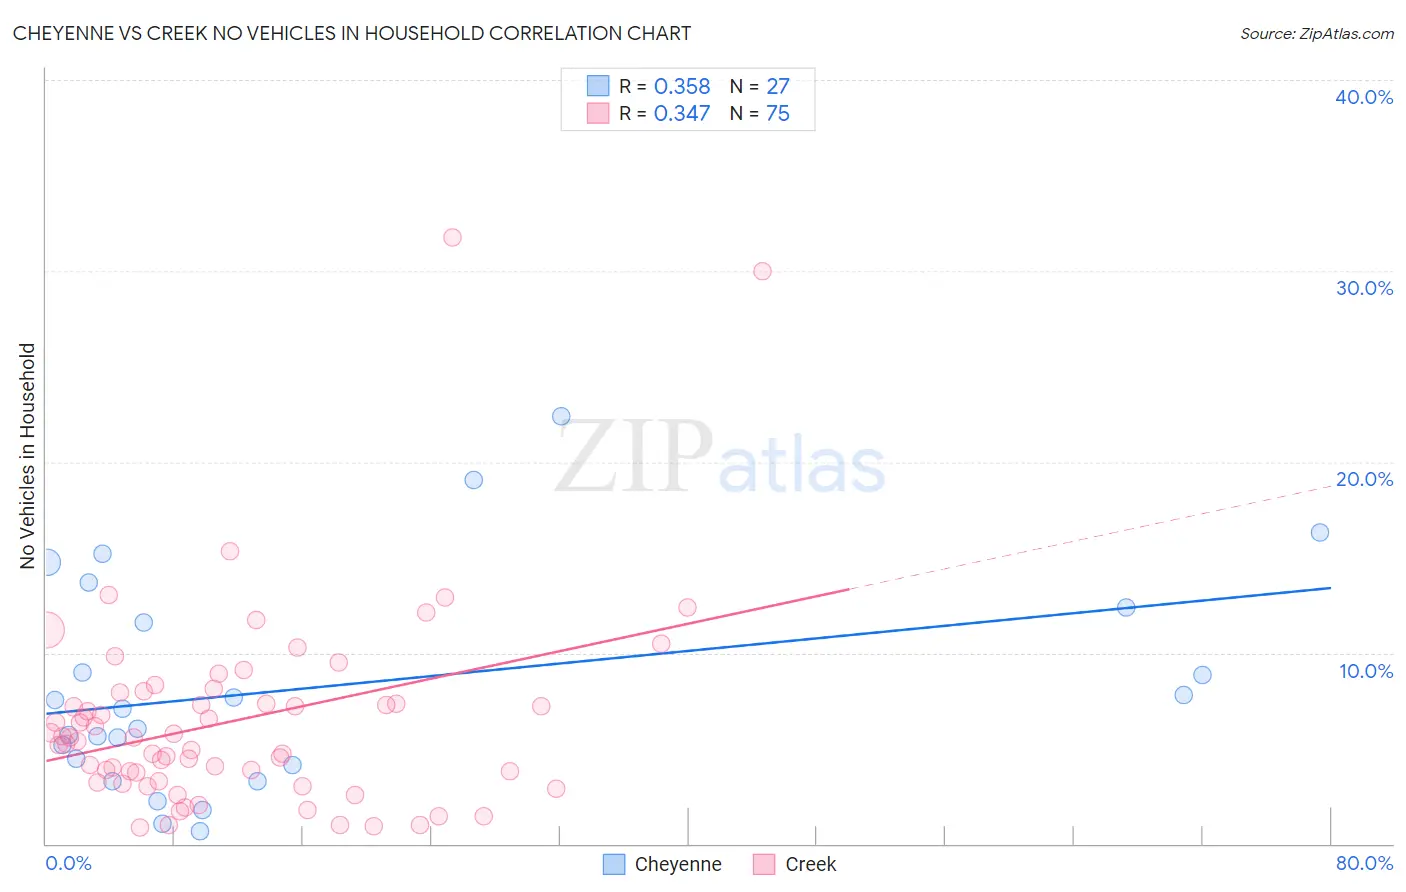
Cheyenne vs Creek No Vehicles in Household Correlation Chart
The statistical analysis conducted on geographies consisting of 80,645,180 people shows a mild positive correlation between the proportion of Cheyenne and percentage of households with no vehicle available in the United States with a correlation coefficient (R) of 0.358 and weighted average of 11.7%. Similarly, the statistical analysis conducted on geographies consisting of 178,241,214 people shows a mild positive correlation between the proportion of Creek and percentage of households with no vehicle available in the United States with a correlation coefficient (R) of 0.347 and weighted average of 7.8%, a difference of 50.6%.
No Vehicles in Household Correlation Summary
| Measurement | Cheyenne | Creek |
| Minimum | 0.64% | 0.83% |
| Maximum | 22.4% | 31.7% |
| Range | 21.7% | 30.9% |
| Mean | 8.2% | 6.4% |
| Median | 7.1% | 5.5% |
| Interquartile 25% (IQ1) | 4.1% | 3.2% |
| Interquartile 75% (IQ3) | 12.4% | 7.9% |
| Interquartile Range (IQR) | 8.3% | 4.7% |
| Standard Deviation (Sample) | 5.7% | 5.2% |
| Standard Deviation (Population) | 5.6% | 5.2% |
Similar Demographics by No Vehicles in Household
Demographics Similar to Cheyenne by No Vehicles in Household
In terms of no vehicles in household, the demographic groups most similar to Cheyenne are Immigrants from Portugal (11.7%, a difference of 0.18%), Turkish (11.7%, a difference of 0.33%), Immigrants from Honduras (11.8%, a difference of 0.37%), Eastern European (11.7%, a difference of 0.44%), and Immigrants (11.7%, a difference of 0.45%).
| Demographics | Rating | Rank | No Vehicles in Household |
| Cree | 3.5 /100 | #236 | Tragic 11.6% |
| Ute | 3.3 /100 | #237 | Tragic 11.6% |
| Russians | 3.2 /100 | #238 | Tragic 11.6% |
| Taiwanese | 2.8 /100 | #239 | Tragic 11.7% |
| Immigrants | Immigrants | 2.7 /100 | #240 | Tragic 11.7% |
| Eastern Europeans | 2.7 /100 | #241 | Tragic 11.7% |
| Turks | 2.6 /100 | #242 | Tragic 11.7% |
| Cheyenne | 2.4 /100 | #243 | Tragic 11.7% |
| Immigrants | Portugal | 2.2 /100 | #244 | Tragic 11.7% |
| Immigrants | Honduras | 2.1 /100 | #245 | Tragic 11.8% |
| Menominee | 2.0 /100 | #246 | Tragic 11.8% |
| Immigrants | Czechoslovakia | 2.0 /100 | #247 | Tragic 11.8% |
| Immigrants | Belgium | 1.9 /100 | #248 | Tragic 11.8% |
| Immigrants | Nigeria | 1.9 /100 | #249 | Tragic 11.8% |
| Paiute | 1.8 /100 | #250 | Tragic 11.8% |
Demographics Similar to Creek by No Vehicles in Household
In terms of no vehicles in household, the demographic groups most similar to Creek are Basque (7.8%, a difference of 0.14%), Iraqi (7.7%, a difference of 0.39%), Cherokee (7.7%, a difference of 0.52%), Immigrants from Fiji (7.8%, a difference of 0.58%), and Immigrants from Vietnam (7.7%, a difference of 0.67%).
| Demographics | Rating | Rank | No Vehicles in Household |
| Native Hawaiians | 100.0 /100 | #31 | Exceptional 7.7% |
| Malaysians | 100.0 /100 | #32 | Exceptional 7.7% |
| Immigrants | Taiwan | 100.0 /100 | #33 | Exceptional 7.7% |
| Immigrants | Vietnam | 100.0 /100 | #34 | Exceptional 7.7% |
| Cherokee | 99.9 /100 | #35 | Exceptional 7.7% |
| Iraqis | 99.9 /100 | #36 | Exceptional 7.7% |
| Basques | 99.9 /100 | #37 | Exceptional 7.8% |
| Creek | 99.9 /100 | #38 | Exceptional 7.8% |
| Immigrants | Fiji | 99.9 /100 | #39 | Exceptional 7.8% |
| Czechoslovakians | 99.9 /100 | #40 | Exceptional 7.8% |
| French Canadians | 99.9 /100 | #41 | Exceptional 7.8% |
| Swiss | 99.9 /100 | #42 | Exceptional 7.9% |
| Chickasaw | 99.9 /100 | #43 | Exceptional 7.9% |
| Choctaw | 99.9 /100 | #44 | Exceptional 7.9% |
| Immigrants | Nonimmigrants | 99.9 /100 | #45 | Exceptional 7.9% |