Immigrants from Caribbean vs Immigrants from Western Asia 4 or more Vehicles in Household
COMPARE
Immigrants from Caribbean
Immigrants from Western Asia
4 or more Vehicles in Household
4 or more Vehicles in Household Comparison
Immigrants from Caribbean
Immigrants from Western Asia
4.4%
4 OR MORE VEHICLES IN HOUSEHOLD
0.0/ 100
METRIC RATING
323rd/ 347
METRIC RANK
5.9%
4 OR MORE VEHICLES IN HOUSEHOLD
7.8/ 100
METRIC RATING
227th/ 347
METRIC RANK
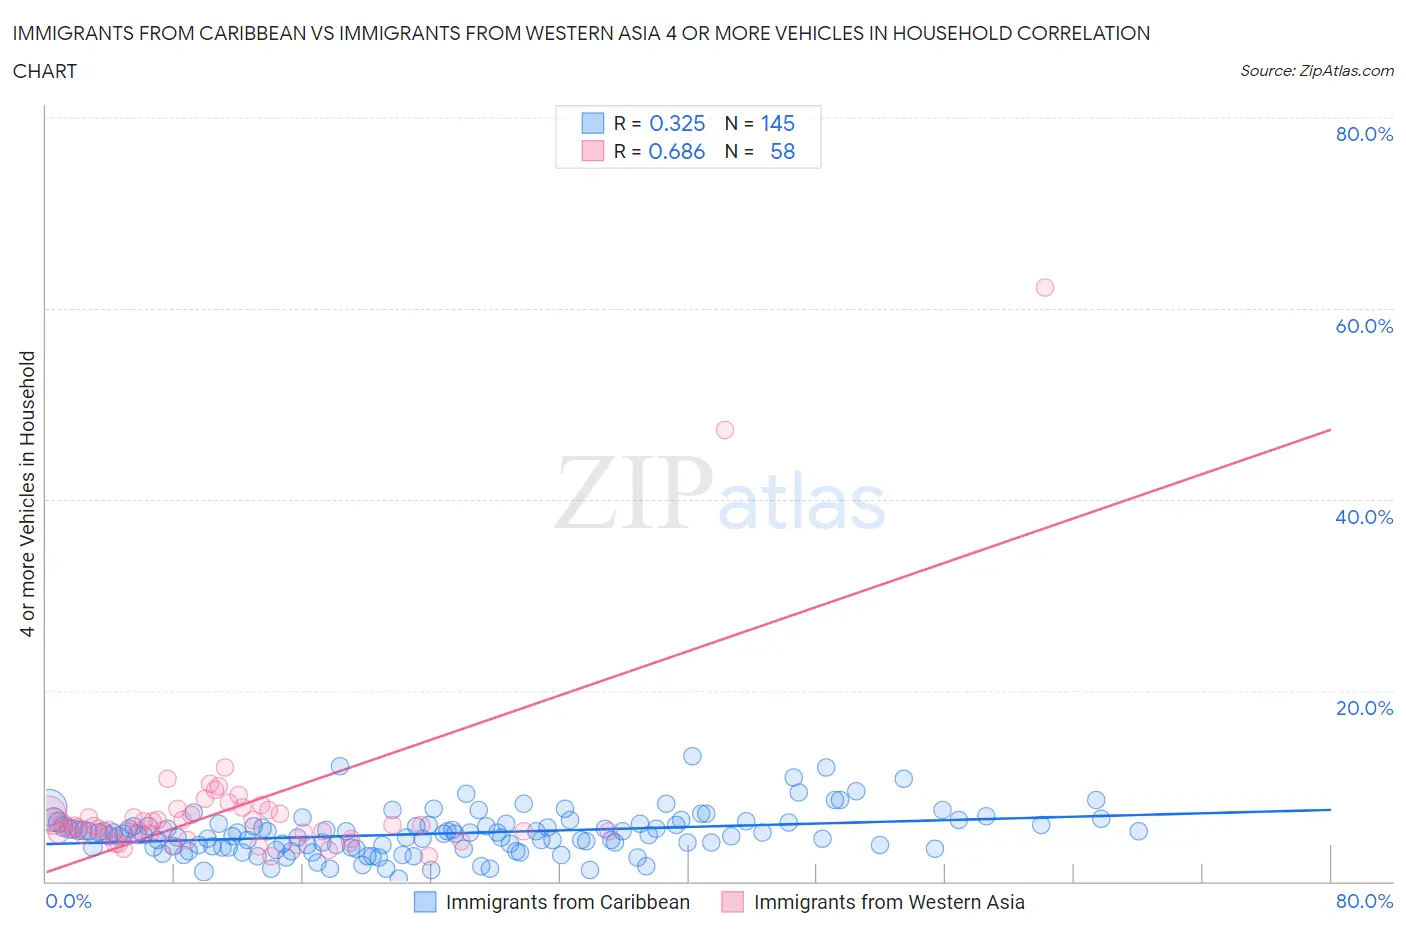
Immigrants from Caribbean vs Immigrants from Western Asia 4 or more Vehicles in Household Correlation Chart
The statistical analysis conducted on geographies consisting of 447,619,354 people shows a mild positive correlation between the proportion of Immigrants from Caribbean and percentage of households with 4 or more vehicles available in the United States with a correlation coefficient (R) of 0.325 and weighted average of 4.4%. Similarly, the statistical analysis conducted on geographies consisting of 402,393,776 people shows a significant positive correlation between the proportion of Immigrants from Western Asia and percentage of households with 4 or more vehicles available in the United States with a correlation coefficient (R) of 0.686 and weighted average of 5.9%, a difference of 33.6%.
4 or more Vehicles in Household Correlation Summary
| Measurement | Immigrants from Caribbean | Immigrants from Western Asia |
| Minimum | 0.20% | 2.6% |
| Maximum | 13.0% | 62.2% |
| Range | 12.8% | 59.5% |
| Mean | 5.0% | 7.7% |
| Median | 4.9% | 5.8% |
| Interquartile 25% (IQ1) | 3.6% | 5.0% |
| Interquartile 75% (IQ3) | 5.9% | 7.1% |
| Interquartile Range (IQR) | 2.4% | 2.1% |
| Standard Deviation (Sample) | 2.2% | 9.3% |
| Standard Deviation (Population) | 2.2% | 9.2% |
Similar Demographics by 4 or more Vehicles in Household
Demographics Similar to Immigrants from Caribbean by 4 or more Vehicles in Household
In terms of 4 or more vehicles in household, the demographic groups most similar to Immigrants from Caribbean are Soviet Union (4.4%, a difference of 0.28%), Immigrants from Yemen (4.5%, a difference of 0.40%), Ecuadorian (4.5%, a difference of 0.58%), Immigrants from Jamaica (4.4%, a difference of 0.60%), and Cape Verdean (4.4%, a difference of 0.92%).
| Demographics | Rating | Rank | 4 or more Vehicles in Household |
| Puerto Ricans | 0.0 /100 | #316 | Tragic 4.7% |
| U.S. Virgin Islanders | 0.0 /100 | #317 | Tragic 4.6% |
| Jamaicans | 0.0 /100 | #318 | Tragic 4.6% |
| Haitians | 0.0 /100 | #319 | Tragic 4.6% |
| Immigrants | Haiti | 0.0 /100 | #320 | Tragic 4.5% |
| Ecuadorians | 0.0 /100 | #321 | Tragic 4.5% |
| Immigrants | Yemen | 0.0 /100 | #322 | Tragic 4.5% |
| Immigrants | Caribbean | 0.0 /100 | #323 | Tragic 4.4% |
| Soviet Union | 0.0 /100 | #324 | Tragic 4.4% |
| Immigrants | Jamaica | 0.0 /100 | #325 | Tragic 4.4% |
| Cape Verdeans | 0.0 /100 | #326 | Tragic 4.4% |
| Senegalese | 0.0 /100 | #327 | Tragic 4.3% |
| Trinidadians and Tobagonians | 0.0 /100 | #328 | Tragic 4.3% |
| Immigrants | Senegal | 0.0 /100 | #329 | Tragic 4.2% |
| Immigrants | Ecuador | 0.0 /100 | #330 | Tragic 4.2% |
Demographics Similar to Immigrants from Western Asia by 4 or more Vehicles in Household
In terms of 4 or more vehicles in household, the demographic groups most similar to Immigrants from Western Asia are Immigrants from Singapore (5.9%, a difference of 0.040%), Immigrants from Uganda (5.9%, a difference of 0.090%), Eastern European (5.9%, a difference of 0.38%), Indonesian (6.0%, a difference of 0.41%), and Immigrants from Malaysia (5.9%, a difference of 0.44%).
| Demographics | Rating | Rank | 4 or more Vehicles in Household |
| Russians | 10.3 /100 | #220 | Poor 6.0% |
| Immigrants | Moldova | 9.3 /100 | #221 | Tragic 6.0% |
| Cajuns | 9.2 /100 | #222 | Tragic 6.0% |
| Immigrants | Kenya | 9.2 /100 | #223 | Tragic 6.0% |
| Cubans | 9.2 /100 | #224 | Tragic 6.0% |
| Indonesians | 8.9 /100 | #225 | Tragic 6.0% |
| Immigrants | Singapore | 7.9 /100 | #226 | Tragic 5.9% |
| Immigrants | Western Asia | 7.8 /100 | #227 | Tragic 5.9% |
| Immigrants | Uganda | 7.5 /100 | #228 | Tragic 5.9% |
| Eastern Europeans | 6.8 /100 | #229 | Tragic 5.9% |
| Immigrants | Malaysia | 6.7 /100 | #230 | Tragic 5.9% |
| Immigrants | Switzerland | 6.4 /100 | #231 | Tragic 5.9% |
| Immigrants | Argentina | 6.0 /100 | #232 | Tragic 5.9% |
| Sierra Leoneans | 6.0 /100 | #233 | Tragic 5.9% |
| Africans | 4.6 /100 | #234 | Tragic 5.8% |