Carpatho Rusyn vs Immigrants from Ukraine Child Poverty Among Girls Under 16
COMPARE
Carpatho Rusyn
Immigrants from Ukraine
Child Poverty Among Girls Under 16
Child Poverty Among Girls Under 16 Comparison
Carpatho Rusyns
Immigrants from Ukraine
15.3%
CHILD POVERTY AMONG GIRLS UNDER 16
91.4/ 100
METRIC RATING
124th/ 347
METRIC RANK
15.1%
CHILD POVERTY AMONG GIRLS UNDER 16
95.0/ 100
METRIC RATING
107th/ 347
METRIC RANK
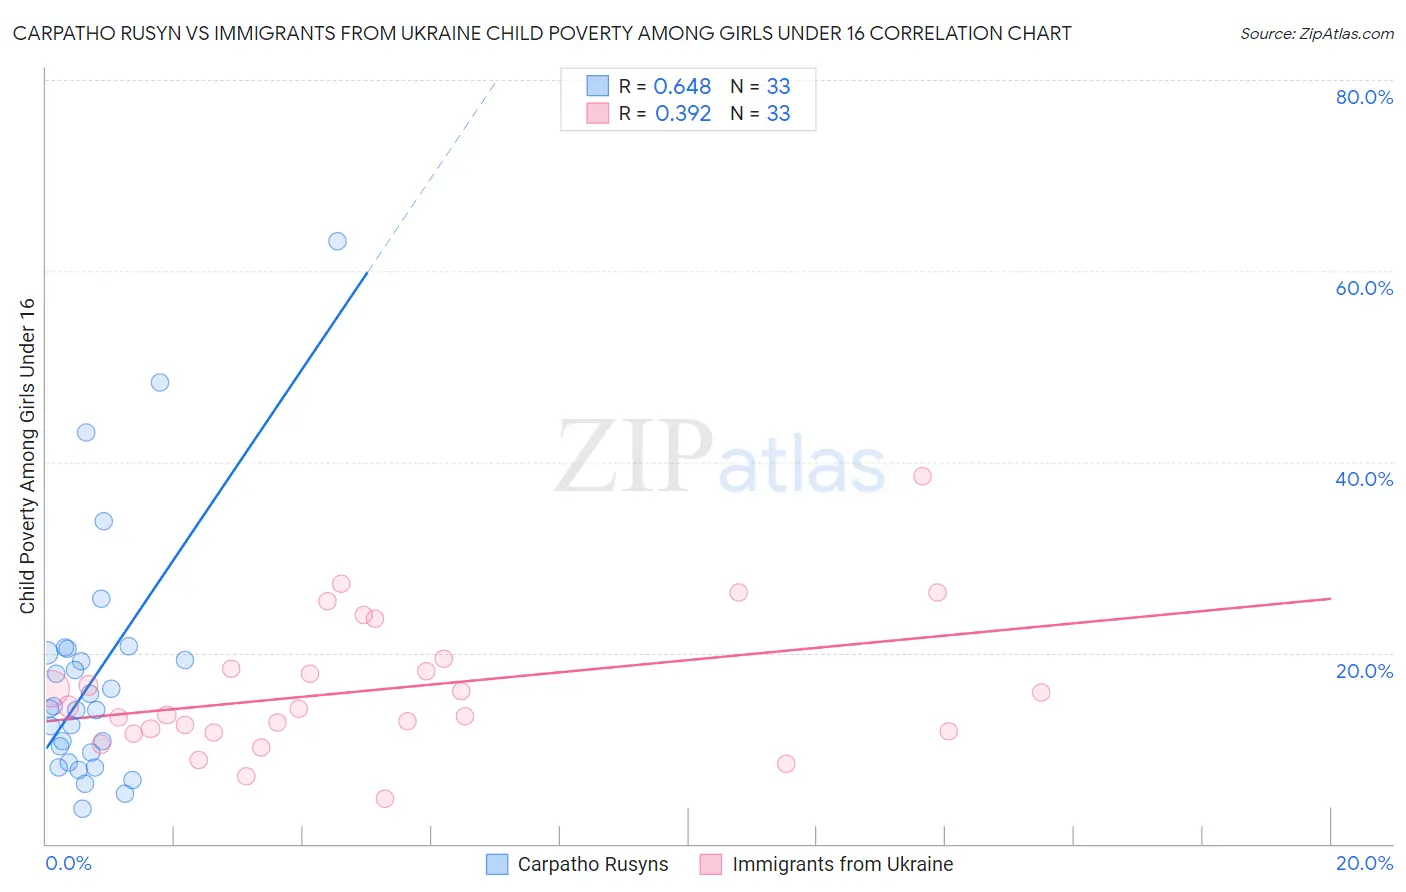
Carpatho Rusyn vs Immigrants from Ukraine Child Poverty Among Girls Under 16 Correlation Chart
The statistical analysis conducted on geographies consisting of 58,411,272 people shows a significant positive correlation between the proportion of Carpatho Rusyns and poverty level among girls under the age of 16 in the United States with a correlation coefficient (R) of 0.648 and weighted average of 15.3%. Similarly, the statistical analysis conducted on geographies consisting of 284,790,149 people shows a mild positive correlation between the proportion of Immigrants from Ukraine and poverty level among girls under the age of 16 in the United States with a correlation coefficient (R) of 0.392 and weighted average of 15.1%, a difference of 1.8%.
Child Poverty Among Girls Under 16 Correlation Summary
| Measurement | Carpatho Rusyn | Immigrants from Ukraine |
| Minimum | 3.6% | 4.7% |
| Maximum | 63.2% | 38.5% |
| Range | 59.5% | 33.8% |
| Mean | 17.5% | 16.1% |
| Median | 14.2% | 14.2% |
| Interquartile 25% (IQ1) | 9.1% | 11.7% |
| Interquartile 75% (IQ3) | 20.2% | 18.9% |
| Interquartile Range (IQR) | 11.2% | 7.2% |
| Standard Deviation (Sample) | 12.9% | 7.1% |
| Standard Deviation (Population) | 12.7% | 7.0% |
Demographics Similar to Carpatho Rusyns and Immigrants from Ukraine by Child Poverty Among Girls Under 16
In terms of child poverty among girls under 16, the demographic groups most similar to Carpatho Rusyns are Irish (15.3%, a difference of 0.050%), Peruvian (15.4%, a difference of 0.11%), Portuguese (15.3%, a difference of 0.14%), English (15.3%, a difference of 0.33%), and Pakistani (15.3%, a difference of 0.35%). Similarly, the demographic groups most similar to Immigrants from Ukraine are Chilean (15.1%, a difference of 0.060%), Immigrants from England (15.1%, a difference of 0.070%), Immigrants from Brazil (15.1%, a difference of 0.070%), Serbian (15.1%, a difference of 0.16%), and Immigrants from Croatia (15.1%, a difference of 0.28%).
| Demographics | Rating | Rank | Child Poverty Among Girls Under 16 |
| Immigrants | England | 95.1 /100 | #105 | Exceptional 15.1% |
| Chileans | 95.1 /100 | #106 | Exceptional 15.1% |
| Immigrants | Ukraine | 95.0 /100 | #107 | Exceptional 15.1% |
| Immigrants | Brazil | 94.9 /100 | #108 | Exceptional 15.1% |
| Serbians | 94.8 /100 | #109 | Exceptional 15.1% |
| Immigrants | Croatia | 94.6 /100 | #110 | Exceptional 15.1% |
| Palestinians | 94.5 /100 | #111 | Exceptional 15.1% |
| Immigrants | Kazakhstan | 94.3 /100 | #112 | Exceptional 15.1% |
| Dutch | 94.3 /100 | #113 | Exceptional 15.1% |
| Sri Lankans | 94.0 /100 | #114 | Exceptional 15.2% |
| Belgians | 93.9 /100 | #115 | Exceptional 15.2% |
| Immigrants | Denmark | 93.3 /100 | #116 | Exceptional 15.2% |
| Immigrants | North Macedonia | 93.1 /100 | #117 | Exceptional 15.2% |
| Immigrants | Southern Europe | 92.7 /100 | #118 | Exceptional 15.3% |
| Immigrants | Zimbabwe | 92.5 /100 | #119 | Exceptional 15.3% |
| Pakistanis | 92.3 /100 | #120 | Exceptional 15.3% |
| English | 92.2 /100 | #121 | Exceptional 15.3% |
| Portuguese | 91.8 /100 | #122 | Exceptional 15.3% |
| Irish | 91.5 /100 | #123 | Exceptional 15.3% |
| Carpatho Rusyns | 91.4 /100 | #124 | Exceptional 15.3% |
| Peruvians | 91.2 /100 | #125 | Exceptional 15.4% |