Carpatho Rusyn vs Immigrants from Ukraine Female Unemployment
COMPARE
Carpatho Rusyn
Immigrants from Ukraine
Female Unemployment
Female Unemployment Comparison
Carpatho Rusyns
Immigrants from Ukraine
4.7%
FEMALE UNEMPLOYMENT
99.9/ 100
METRIC RATING
16th/ 347
METRIC RANK
5.3%
FEMALE UNEMPLOYMENT
40.1/ 100
METRIC RATING
184th/ 347
METRIC RANK
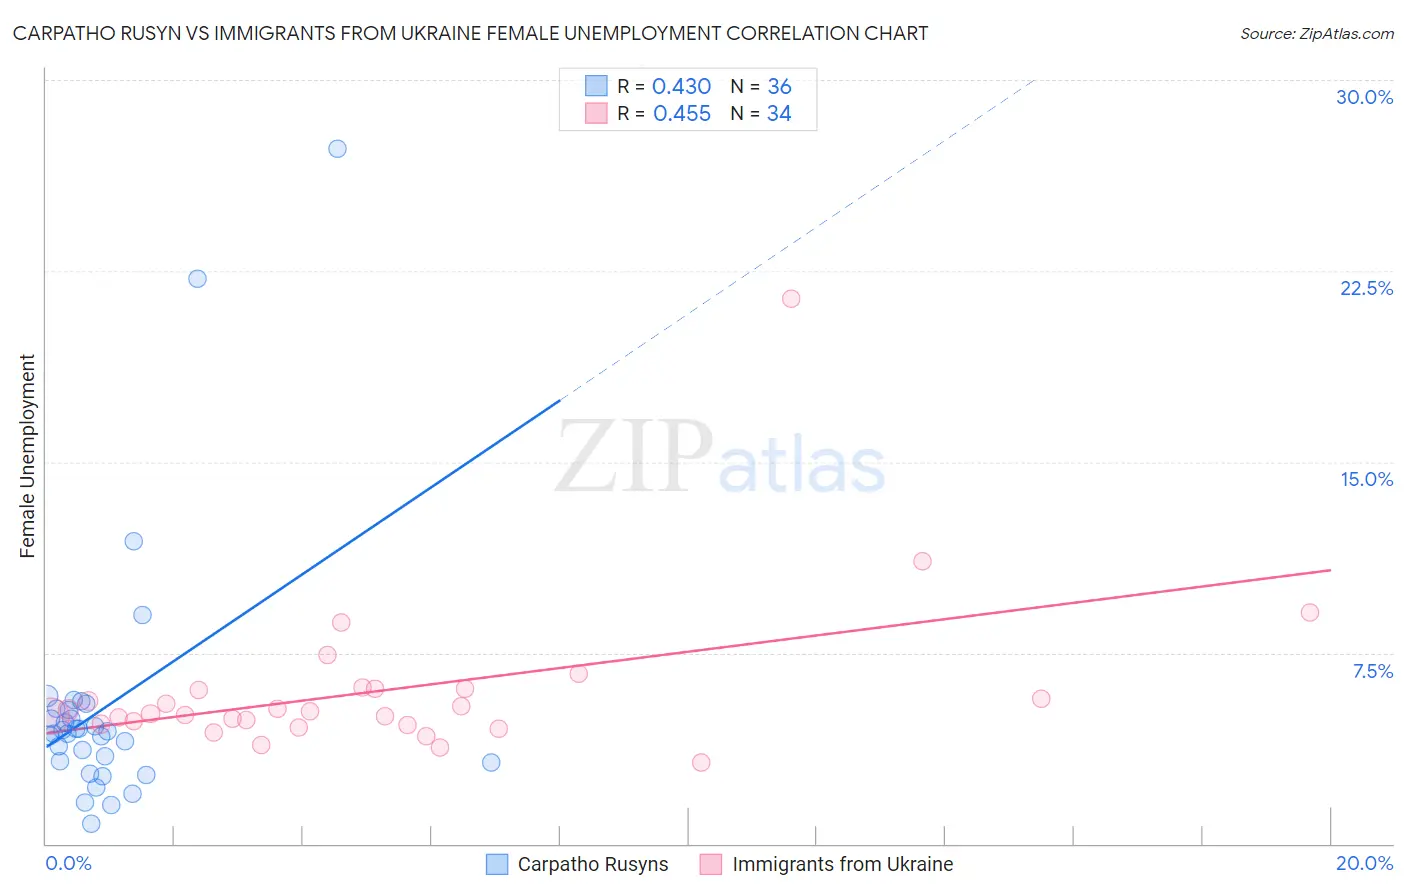
Carpatho Rusyn vs Immigrants from Ukraine Female Unemployment Correlation Chart
The statistical analysis conducted on geographies consisting of 58,788,247 people shows a moderate positive correlation between the proportion of Carpatho Rusyns and unemploymnet rate among females in the United States with a correlation coefficient (R) of 0.430 and weighted average of 4.7%. Similarly, the statistical analysis conducted on geographies consisting of 288,858,006 people shows a moderate positive correlation between the proportion of Immigrants from Ukraine and unemploymnet rate among females in the United States with a correlation coefficient (R) of 0.455 and weighted average of 5.3%, a difference of 13.2%.
Female Unemployment Correlation Summary
| Measurement | Carpatho Rusyn | Immigrants from Ukraine |
| Minimum | 0.80% | 3.2% |
| Maximum | 27.3% | 21.4% |
| Range | 26.5% | 18.2% |
| Mean | 5.4% | 6.0% |
| Median | 4.4% | 5.2% |
| Interquartile 25% (IQ1) | 3.2% | 4.7% |
| Interquartile 75% (IQ3) | 5.3% | 6.1% |
| Interquartile Range (IQR) | 2.1% | 1.4% |
| Standard Deviation (Sample) | 5.2% | 3.1% |
| Standard Deviation (Population) | 5.1% | 3.1% |
Similar Demographics by Female Unemployment
Demographics Similar to Carpatho Rusyns by Female Unemployment
In terms of female unemployment, the demographic groups most similar to Carpatho Rusyns are Croatian (4.7%, a difference of 0.020%), Latvian (4.7%, a difference of 0.16%), Polish (4.7%, a difference of 0.17%), Bulgarian (4.7%, a difference of 0.25%), and Fijian (4.7%, a difference of 0.27%).
| Demographics | Rating | Rank | Female Unemployment |
| Slovenes | 100.0 /100 | #9 | Exceptional 4.5% |
| Swiss | 100.0 /100 | #10 | Exceptional 4.6% |
| Scandinavians | 100.0 /100 | #11 | Exceptional 4.6% |
| Dutch | 100.0 /100 | #12 | Exceptional 4.6% |
| Belgians | 100.0 /100 | #13 | Exceptional 4.6% |
| Finns | 100.0 /100 | #14 | Exceptional 4.6% |
| English | 100.0 /100 | #15 | Exceptional 4.6% |
| Carpatho Rusyns | 99.9 /100 | #16 | Exceptional 4.7% |
| Croatians | 99.9 /100 | #17 | Exceptional 4.7% |
| Latvians | 99.9 /100 | #18 | Exceptional 4.7% |
| Poles | 99.9 /100 | #19 | Exceptional 4.7% |
| Bulgarians | 99.9 /100 | #20 | Exceptional 4.7% |
| Fijians | 99.9 /100 | #21 | Exceptional 4.7% |
| Europeans | 99.9 /100 | #22 | Exceptional 4.7% |
| Scottish | 99.9 /100 | #23 | Exceptional 4.7% |
Demographics Similar to Immigrants from Ukraine by Female Unemployment
In terms of female unemployment, the demographic groups most similar to Immigrants from Ukraine are Malaysian (5.3%, a difference of 0.010%), Immigrants from Indonesia (5.3%, a difference of 0.030%), Immigrants from Belarus (5.3%, a difference of 0.050%), Nonimmigrants (5.3%, a difference of 0.15%), and Taiwanese (5.3%, a difference of 0.16%).
| Demographics | Rating | Rank | Female Unemployment |
| Immigrants | Morocco | 47.4 /100 | #177 | Average 5.3% |
| Immigrants | Southern Europe | 46.2 /100 | #178 | Average 5.3% |
| Laotians | 45.1 /100 | #179 | Average 5.3% |
| Immigrants | Congo | 43.1 /100 | #180 | Average 5.3% |
| Taiwanese | 42.7 /100 | #181 | Average 5.3% |
| Immigrants | Nonimmigrants | 42.6 /100 | #182 | Average 5.3% |
| Immigrants | Indonesia | 40.7 /100 | #183 | Average 5.3% |
| Immigrants | Ukraine | 40.1 /100 | #184 | Average 5.3% |
| Malaysians | 40.1 /100 | #185 | Average 5.3% |
| Immigrants | Belarus | 39.4 /100 | #186 | Fair 5.3% |
| Immigrants | Albania | 35.4 /100 | #187 | Fair 5.3% |
| Afghans | 33.9 /100 | #188 | Fair 5.3% |
| Costa Ricans | 33.8 /100 | #189 | Fair 5.3% |
| Ugandans | 31.2 /100 | #190 | Fair 5.3% |
| Cherokee | 30.8 /100 | #191 | Fair 5.3% |