Canadian vs Immigrants from Egypt 4 or more Vehicles in Household
COMPARE
Canadian
Immigrants from Egypt
4 or more Vehicles in Household
4 or more Vehicles in Household Comparison
Canadians
Immigrants from Egypt
6.9%
4 OR MORE VEHICLES IN HOUSEHOLD
96.4/ 100
METRIC RATING
113th/ 347
METRIC RANK
6.0%
4 OR MORE VEHICLES IN HOUSEHOLD
14.7/ 100
METRIC RATING
212th/ 347
METRIC RANK
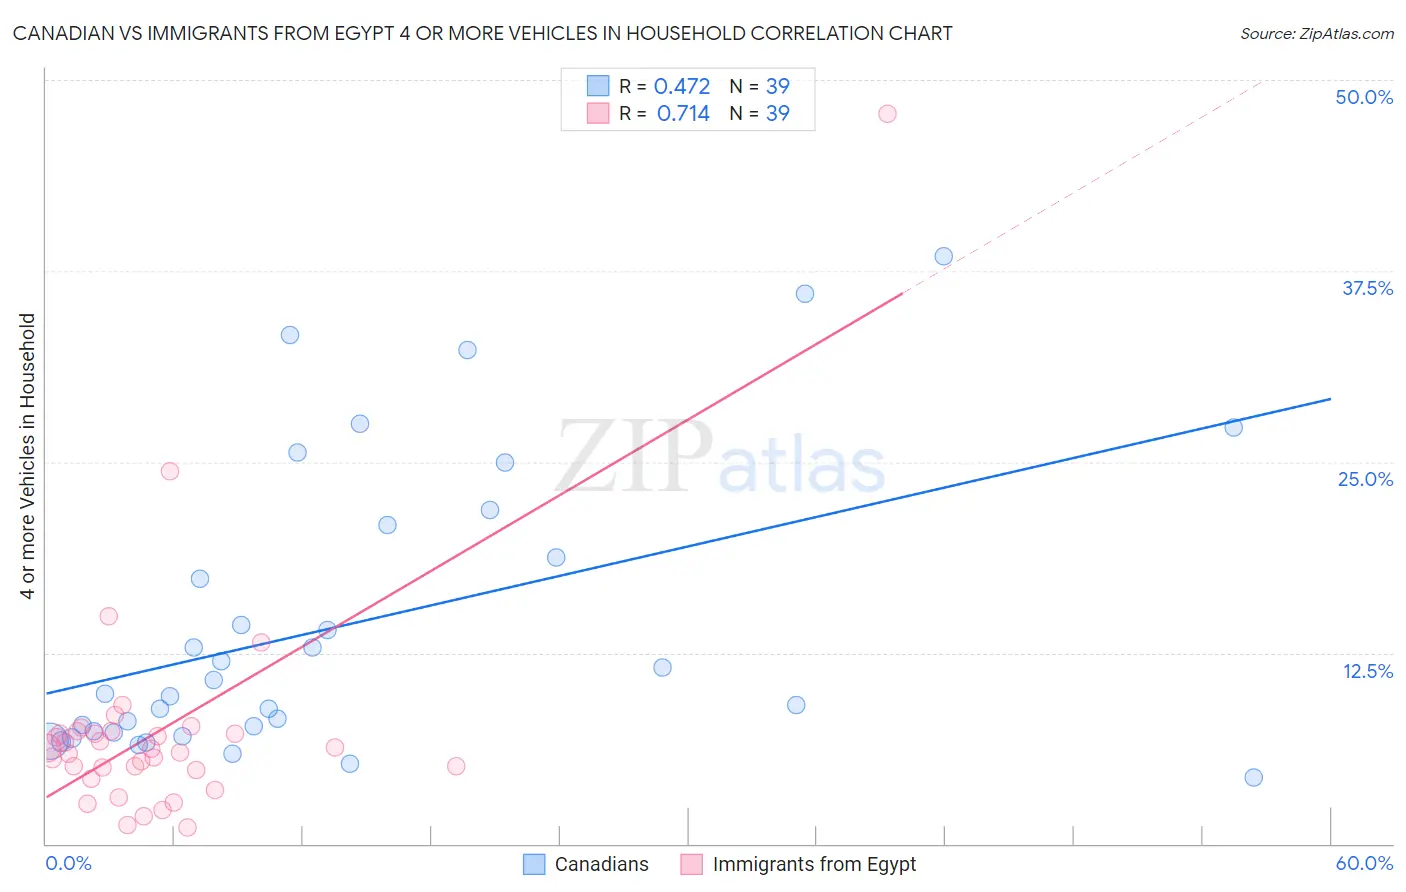
Canadian vs Immigrants from Egypt 4 or more Vehicles in Household Correlation Chart
The statistical analysis conducted on geographies consisting of 435,609,846 people shows a moderate positive correlation between the proportion of Canadians and percentage of households with 4 or more vehicles available in the United States with a correlation coefficient (R) of 0.472 and weighted average of 6.9%. Similarly, the statistical analysis conducted on geographies consisting of 244,625,690 people shows a strong positive correlation between the proportion of Immigrants from Egypt and percentage of households with 4 or more vehicles available in the United States with a correlation coefficient (R) of 0.714 and weighted average of 6.0%, a difference of 13.4%.
4 or more Vehicles in Household Correlation Summary
| Measurement | Canadian | Immigrants from Egypt |
| Minimum | 4.3% | 1.1% |
| Maximum | 38.5% | 47.8% |
| Range | 34.1% | 46.7% |
| Mean | 14.4% | 7.5% |
| Median | 9.9% | 6.2% |
| Interquartile 25% (IQ1) | 7.3% | 4.8% |
| Interquartile 75% (IQ3) | 20.9% | 7.3% |
| Interquartile Range (IQR) | 13.6% | 2.5% |
| Standard Deviation (Sample) | 9.6% | 7.8% |
| Standard Deviation (Population) | 9.4% | 7.7% |
Similar Demographics by 4 or more Vehicles in Household
Demographics Similar to Canadians by 4 or more Vehicles in Household
In terms of 4 or more vehicles in household, the demographic groups most similar to Canadians are Bolivian (6.8%, a difference of 0.050%), Tlingit-Haida (6.8%, a difference of 0.11%), Immigrants from Guatemala (6.8%, a difference of 0.37%), Burmese (6.8%, a difference of 0.40%), and French American Indian (6.8%, a difference of 0.40%).
| Demographics | Rating | Rank | 4 or more Vehicles in Household |
| Guatemalans | 98.1 /100 | #106 | Exceptional 7.0% |
| Nicaraguans | 98.0 /100 | #107 | Exceptional 7.0% |
| French | 97.7 /100 | #108 | Exceptional 6.9% |
| Filipinos | 97.6 /100 | #109 | Exceptional 6.9% |
| Immigrants | Thailand | 97.0 /100 | #110 | Exceptional 6.9% |
| Aleuts | 97.0 /100 | #111 | Exceptional 6.9% |
| Hopi | 97.0 /100 | #112 | Exceptional 6.9% |
| Canadians | 96.4 /100 | #113 | Exceptional 6.9% |
| Bolivians | 96.3 /100 | #114 | Exceptional 6.8% |
| Tlingit-Haida | 96.2 /100 | #115 | Exceptional 6.8% |
| Immigrants | Guatemala | 95.8 /100 | #116 | Exceptional 6.8% |
| Burmese | 95.7 /100 | #117 | Exceptional 6.8% |
| French American Indians | 95.7 /100 | #118 | Exceptional 6.8% |
| Costa Ricans | 95.5 /100 | #119 | Exceptional 6.8% |
| Comanche | 94.8 /100 | #120 | Exceptional 6.8% |
Demographics Similar to Immigrants from Egypt by 4 or more Vehicles in Household
In terms of 4 or more vehicles in household, the demographic groups most similar to Immigrants from Egypt are Panamanian (6.0%, a difference of 0.020%), Arab (6.0%, a difference of 0.060%), Immigrants from Austria (6.0%, a difference of 0.080%), Immigrants from Zimbabwe (6.0%, a difference of 0.10%), and Immigrants from Honduras (6.1%, a difference of 0.15%).
| Demographics | Rating | Rank | 4 or more Vehicles in Household |
| Hondurans | 19.3 /100 | #205 | Poor 6.1% |
| Kenyans | 18.5 /100 | #206 | Poor 6.1% |
| Immigrants | Chile | 16.9 /100 | #207 | Poor 6.1% |
| Immigrants | Nigeria | 15.6 /100 | #208 | Poor 6.1% |
| Immigrants | Honduras | 15.4 /100 | #209 | Poor 6.1% |
| Immigrants | Zimbabwe | 15.1 /100 | #210 | Poor 6.0% |
| Panamanians | 14.8 /100 | #211 | Poor 6.0% |
| Immigrants | Egypt | 14.7 /100 | #212 | Poor 6.0% |
| Arabs | 14.4 /100 | #213 | Poor 6.0% |
| Immigrants | Austria | 14.3 /100 | #214 | Poor 6.0% |
| Immigrants | China | 13.8 /100 | #215 | Poor 6.0% |
| Immigrants | Romania | 13.8 /100 | #216 | Poor 6.0% |
| Nigerians | 12.2 /100 | #217 | Poor 6.0% |
| Immigrants | Italy | 11.0 /100 | #218 | Poor 6.0% |
| Serbians | 11.0 /100 | #219 | Poor 6.0% |