British West Indian vs Scotch-Irish Unemployment Among Ages 55 to 59 years
COMPARE
British West Indian
Scotch-Irish
Unemployment Among Ages 55 to 59 years
Unemployment Among Ages 55 to 59 years Comparison
British West Indians
Scotch-Irish
5.3%
UNEMPLOYMENT AMONG AGES 55 TO 59 YEARS
0.0/ 100
METRIC RATING
292nd/ 347
METRIC RANK
4.6%
UNEMPLOYMENT AMONG AGES 55 TO 59 YEARS
98.3/ 100
METRIC RATING
77th/ 347
METRIC RANK
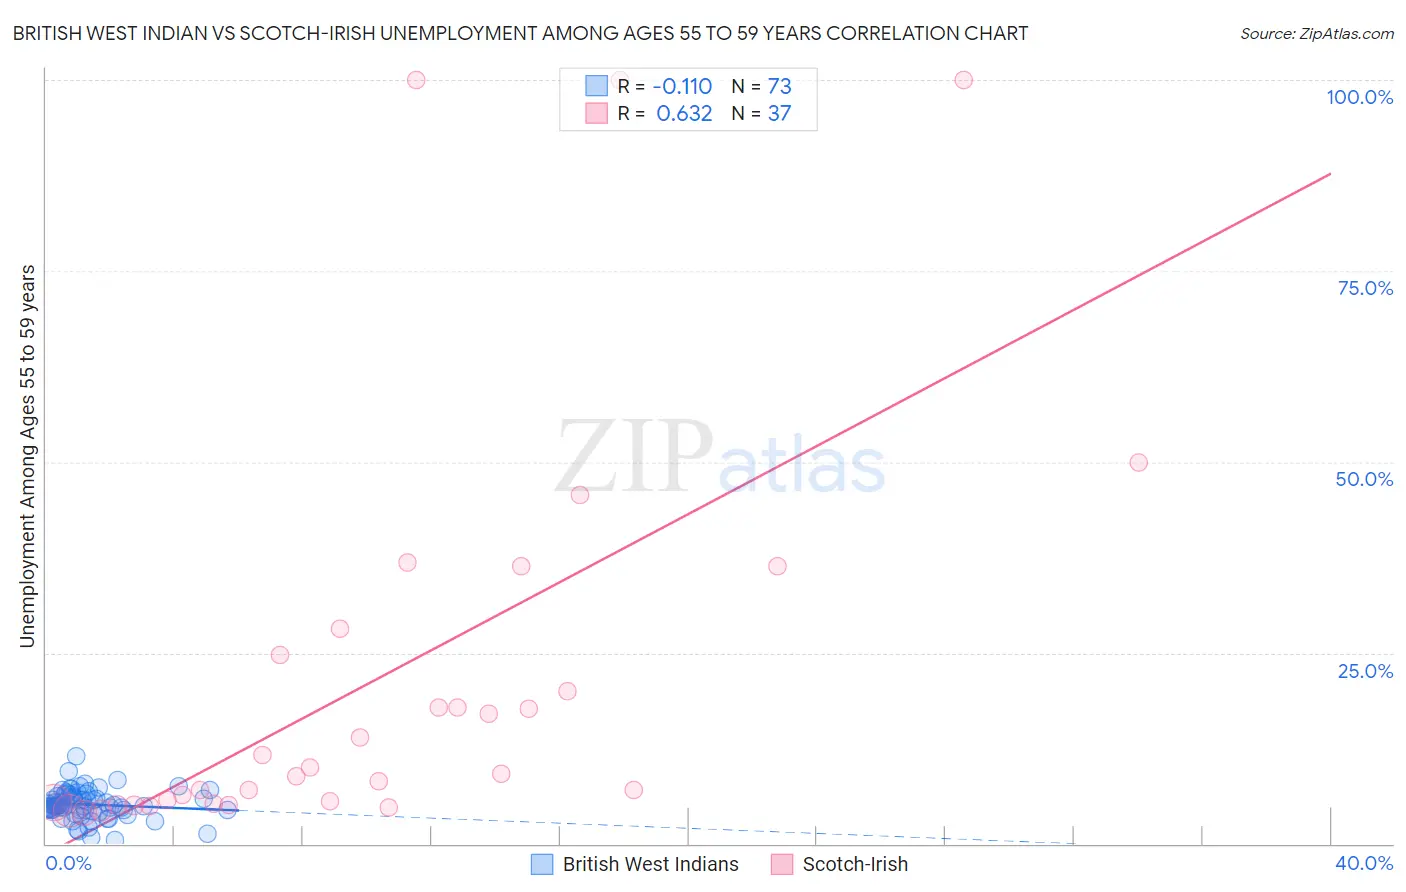
British West Indian vs Scotch-Irish Unemployment Among Ages 55 to 59 years Correlation Chart
The statistical analysis conducted on geographies consisting of 148,255,971 people shows a poor negative correlation between the proportion of British West Indians and unemployment rate among population between the ages 55 and 59 in the United States with a correlation coefficient (R) of -0.110 and weighted average of 5.3%. Similarly, the statistical analysis conducted on geographies consisting of 470,743,617 people shows a significant positive correlation between the proportion of Scotch-Irish and unemployment rate among population between the ages 55 and 59 in the United States with a correlation coefficient (R) of 0.632 and weighted average of 4.6%, a difference of 14.9%.
Unemployment Among Ages 55 to 59 years Correlation Summary
| Measurement | British West Indian | Scotch-Irish |
| Minimum | 0.50% | 4.0% |
| Maximum | 11.5% | 100.0% |
| Range | 11.0% | 96.0% |
| Mean | 5.1% | 21.6% |
| Median | 5.0% | 9.2% |
| Interquartile 25% (IQ1) | 4.4% | 5.3% |
| Interquartile 75% (IQ3) | 6.3% | 26.5% |
| Interquartile Range (IQR) | 1.8% | 21.2% |
| Standard Deviation (Sample) | 1.9% | 26.7% |
| Standard Deviation (Population) | 1.9% | 26.3% |
Similar Demographics by Unemployment Among Ages 55 to 59 years
Demographics Similar to British West Indians by Unemployment Among Ages 55 to 59 years
In terms of unemployment among ages 55 to 59 years, the demographic groups most similar to British West Indians are Trinidadian and Tobagonian (5.3%, a difference of 0.14%), Immigrants from Grenada (5.3%, a difference of 0.19%), Sioux (5.3%, a difference of 0.21%), Immigrants from Central America (5.3%, a difference of 0.24%), and Immigrants from Israel (5.3%, a difference of 0.30%).
| Demographics | Rating | Rank | Unemployment Among Ages 55 to 59 years |
| Armenians | 0.0 /100 | #285 | Tragic 5.3% |
| Immigrants | Ghana | 0.0 /100 | #286 | Tragic 5.3% |
| Immigrants | Guatemala | 0.0 /100 | #287 | Tragic 5.3% |
| Immigrants | Israel | 0.0 /100 | #288 | Tragic 5.3% |
| Immigrants | Central America | 0.0 /100 | #289 | Tragic 5.3% |
| Sioux | 0.0 /100 | #290 | Tragic 5.3% |
| Trinidadians and Tobagonians | 0.0 /100 | #291 | Tragic 5.3% |
| British West Indians | 0.0 /100 | #292 | Tragic 5.3% |
| Immigrants | Grenada | 0.0 /100 | #293 | Tragic 5.3% |
| Cajuns | 0.0 /100 | #294 | Tragic 5.3% |
| Dutch West Indians | 0.0 /100 | #295 | Tragic 5.3% |
| Barbadians | 0.0 /100 | #296 | Tragic 5.3% |
| Immigrants | Mexico | 0.0 /100 | #297 | Tragic 5.3% |
| Hispanics or Latinos | 0.0 /100 | #298 | Tragic 5.4% |
| Cape Verdeans | 0.0 /100 | #299 | Tragic 5.4% |
Demographics Similar to Scotch-Irish by Unemployment Among Ages 55 to 59 years
In terms of unemployment among ages 55 to 59 years, the demographic groups most similar to Scotch-Irish are Immigrants from Bosnia and Herzegovina (4.6%, a difference of 0.010%), Finnish (4.6%, a difference of 0.050%), Immigrants from Iraq (4.6%, a difference of 0.080%), Croatian (4.6%, a difference of 0.10%), and Sri Lankan (4.6%, a difference of 0.14%).
| Demographics | Rating | Rank | Unemployment Among Ages 55 to 59 years |
| Filipinos | 98.8 /100 | #70 | Exceptional 4.6% |
| Immigrants | Jordan | 98.7 /100 | #71 | Exceptional 4.6% |
| Immigrants | Taiwan | 98.7 /100 | #72 | Exceptional 4.6% |
| Bhutanese | 98.6 /100 | #73 | Exceptional 4.6% |
| Croatians | 98.5 /100 | #74 | Exceptional 4.6% |
| Immigrants | Iraq | 98.5 /100 | #75 | Exceptional 4.6% |
| Immigrants | Bosnia and Herzegovina | 98.3 /100 | #76 | Exceptional 4.6% |
| Scotch-Irish | 98.3 /100 | #77 | Exceptional 4.6% |
| Finns | 98.2 /100 | #78 | Exceptional 4.6% |
| Sri Lankans | 98.1 /100 | #79 | Exceptional 4.6% |
| Cambodians | 98.0 /100 | #80 | Exceptional 4.6% |
| Taiwanese | 97.9 /100 | #81 | Exceptional 4.6% |
| Latvians | 97.8 /100 | #82 | Exceptional 4.6% |
| Lebanese | 97.5 /100 | #83 | Exceptional 4.6% |
| Malaysians | 96.9 /100 | #84 | Exceptional 4.7% |