British West Indian vs Slavic 4 or more Vehicles in Household
COMPARE
British West Indian
Slavic
4 or more Vehicles in Household
4 or more Vehicles in Household Comparison
British West Indians
Slavs
3.5%
4 OR MORE VEHICLES IN HOUSEHOLD
0.0/ 100
METRIC RATING
343rd/ 347
METRIC RANK
6.6%
4 OR MORE VEHICLES IN HOUSEHOLD
81.6/ 100
METRIC RATING
140th/ 347
METRIC RANK
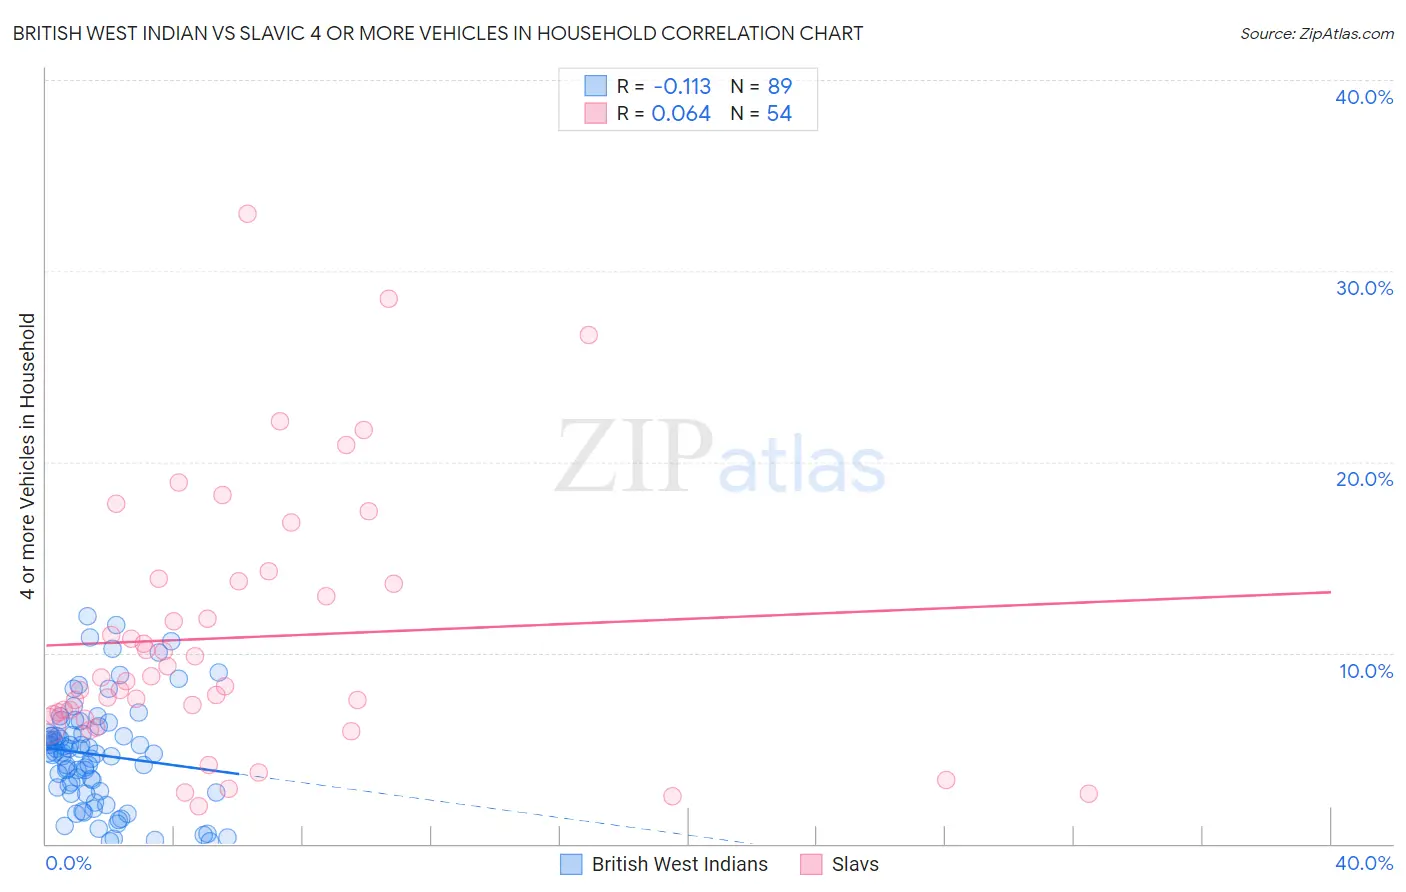
British West Indian vs Slavic 4 or more Vehicles in Household Correlation Chart
The statistical analysis conducted on geographies consisting of 151,775,264 people shows a poor negative correlation between the proportion of British West Indians and percentage of households with 4 or more vehicles available in the United States with a correlation coefficient (R) of -0.113 and weighted average of 3.5%. Similarly, the statistical analysis conducted on geographies consisting of 270,086,100 people shows a slight positive correlation between the proportion of Slavs and percentage of households with 4 or more vehicles available in the United States with a correlation coefficient (R) of 0.064 and weighted average of 6.6%, a difference of 90.1%.
4 or more Vehicles in Household Correlation Summary
| Measurement | British West Indian | Slavic |
| Minimum | 0.11% | 2.0% |
| Maximum | 11.9% | 33.0% |
| Range | 11.8% | 31.0% |
| Mean | 4.7% | 10.8% |
| Median | 4.8% | 8.6% |
| Interquartile 25% (IQ1) | 2.7% | 6.7% |
| Interquartile 75% (IQ3) | 5.7% | 13.7% |
| Interquartile Range (IQR) | 3.0% | 7.0% |
| Standard Deviation (Sample) | 2.7% | 6.8% |
| Standard Deviation (Population) | 2.7% | 6.8% |
Similar Demographics by 4 or more Vehicles in Household
Demographics Similar to British West Indians by 4 or more Vehicles in Household
In terms of 4 or more vehicles in household, the demographic groups most similar to British West Indians are Guyanese (3.5%, a difference of 0.94%), Immigrants from Guyana (3.4%, a difference of 1.6%), Dominican (3.5%, a difference of 1.6%), Immigrants from Barbados (3.6%, a difference of 4.5%), and Immigrants from Uzbekistan (3.6%, a difference of 5.0%).
| Demographics | Rating | Rank | 4 or more Vehicles in Household |
| Immigrants | Albania | 0.0 /100 | #333 | Tragic 4.1% |
| Immigrants | Trinidad and Tobago | 0.0 /100 | #334 | Tragic 4.1% |
| Barbadians | 0.0 /100 | #335 | Tragic 3.9% |
| Immigrants | Bangladesh | 0.0 /100 | #336 | Tragic 3.9% |
| Vietnamese | 0.0 /100 | #337 | Tragic 3.9% |
| Immigrants | Cabo Verde | 0.0 /100 | #338 | Tragic 3.8% |
| Immigrants | Uzbekistan | 0.0 /100 | #339 | Tragic 3.6% |
| Immigrants | Barbados | 0.0 /100 | #340 | Tragic 3.6% |
| Dominicans | 0.0 /100 | #341 | Tragic 3.5% |
| Guyanese | 0.0 /100 | #342 | Tragic 3.5% |
| British West Indians | 0.0 /100 | #343 | Tragic 3.5% |
| Immigrants | Guyana | 0.0 /100 | #344 | Tragic 3.4% |
| Immigrants | Dominican Republic | 0.0 /100 | #345 | Tragic 3.3% |
| Immigrants | St. Vincent and the Grenadines | 0.0 /100 | #346 | Tragic 3.0% |
| Immigrants | Grenada | 0.0 /100 | #347 | Tragic 2.7% |
Demographics Similar to Slavs by 4 or more Vehicles in Household
In terms of 4 or more vehicles in household, the demographic groups most similar to Slavs are Jordanian (6.6%, a difference of 0.080%), Australian (6.6%, a difference of 0.13%), Immigrants from Iraq (6.5%, a difference of 0.33%), Immigrants from Canada (6.5%, a difference of 0.46%), and Immigrants from North America (6.5%, a difference of 0.48%).
| Demographics | Rating | Rank | 4 or more Vehicles in Household |
| Armenians | 86.9 /100 | #133 | Excellent 6.6% |
| Ottawa | 86.9 /100 | #134 | Excellent 6.6% |
| Tohono O'odham | 86.7 /100 | #135 | Excellent 6.6% |
| Luxembourgers | 86.4 /100 | #136 | Excellent 6.6% |
| French Canadians | 85.4 /100 | #137 | Excellent 6.6% |
| Italians | 84.5 /100 | #138 | Excellent 6.6% |
| Jordanians | 82.1 /100 | #139 | Excellent 6.6% |
| Slavs | 81.6 /100 | #140 | Excellent 6.6% |
| Australians | 80.8 /100 | #141 | Excellent 6.6% |
| Immigrants | Iraq | 79.4 /100 | #142 | Good 6.5% |
| Immigrants | Canada | 78.6 /100 | #143 | Good 6.5% |
| Immigrants | North America | 78.5 /100 | #144 | Good 6.5% |
| Croatians | 77.8 /100 | #145 | Good 6.5% |
| Immigrants | Costa Rica | 74.4 /100 | #146 | Good 6.5% |
| Immigrants | Iran | 73.9 /100 | #147 | Good 6.5% |