Black/African American vs Immigrants Child Poverty Under the Age of 16
COMPARE
Black/African American
Immigrants
Child Poverty Under the Age of 16
Child Poverty Under the Age of 16 Comparison
Blacks/African Americans
Immigrants
24.4%
CHILD POVERTY UNDER THE AGE OF 16
0.0/ 100
METRIC RATING
334th/ 347
METRIC RANK
17.5%
CHILD POVERTY UNDER THE AGE OF 16
6.5/ 100
METRIC RATING
212th/ 347
METRIC RANK
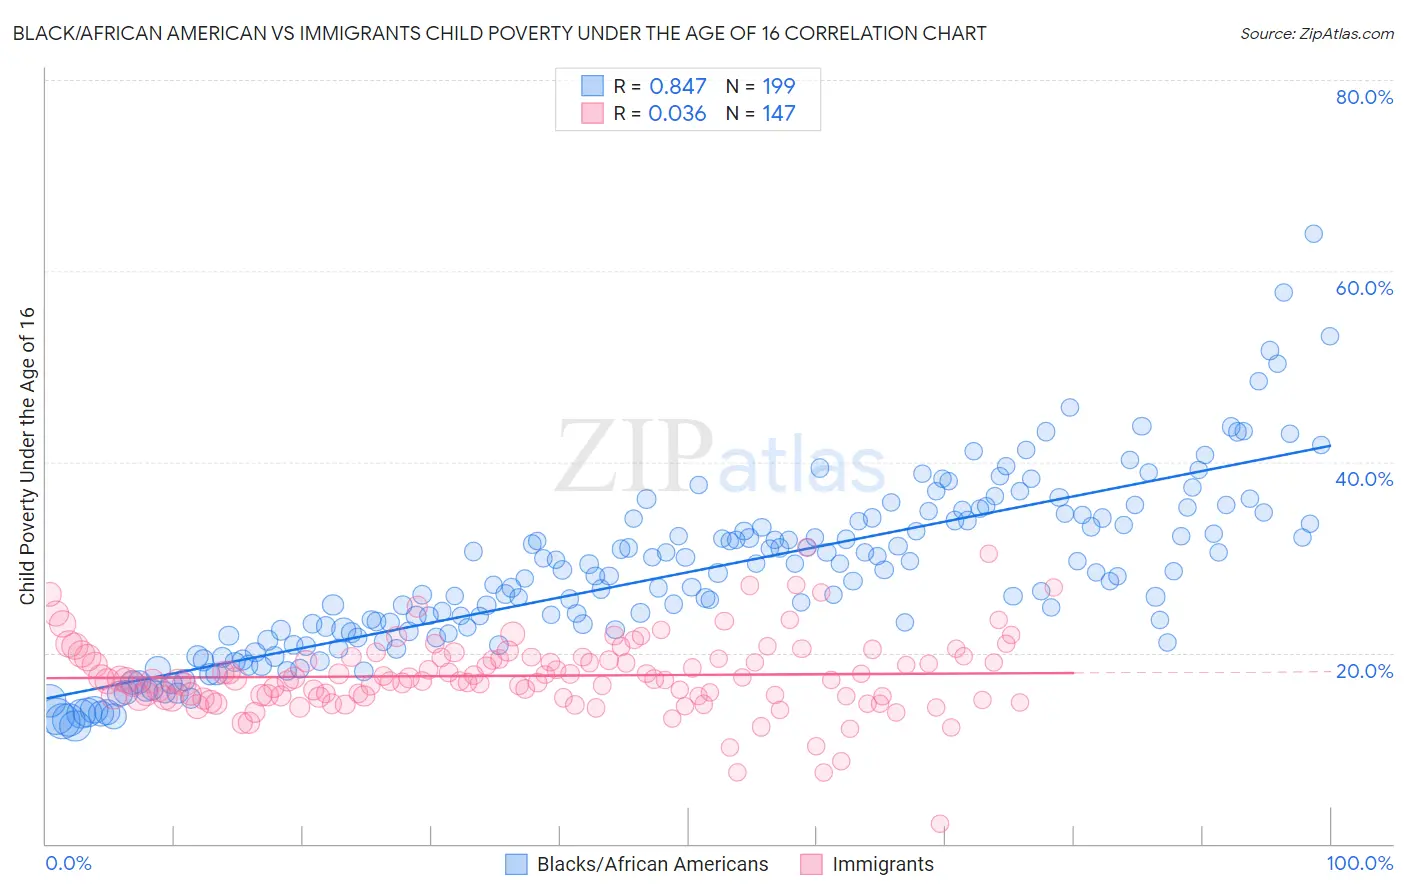
Black/African American vs Immigrants Child Poverty Under the Age of 16 Correlation Chart
The statistical analysis conducted on geographies consisting of 555,331,185 people shows a very strong positive correlation between the proportion of Blacks/African Americans and poverty level among children under the age of 16 in the United States with a correlation coefficient (R) of 0.847 and weighted average of 24.4%. Similarly, the statistical analysis conducted on geographies consisting of 564,478,832 people shows no correlation between the proportion of Immigrants and poverty level among children under the age of 16 in the United States with a correlation coefficient (R) of 0.036 and weighted average of 17.5%, a difference of 39.7%.
Child Poverty Under the Age of 16 Correlation Summary
| Measurement | Black/African American | Immigrants |
| Minimum | 12.3% | 2.1% |
| Maximum | 63.9% | 31.1% |
| Range | 51.6% | 29.0% |
| Mean | 28.4% | 17.6% |
| Median | 28.1% | 17.2% |
| Interquartile 25% (IQ1) | 22.0% | 15.4% |
| Interquartile 75% (IQ3) | 33.9% | 19.6% |
| Interquartile Range (IQR) | 11.9% | 4.2% |
| Standard Deviation (Sample) | 9.0% | 4.0% |
| Standard Deviation (Population) | 9.0% | 4.0% |
Similar Demographics by Child Poverty Under the Age of 16
Demographics Similar to Blacks/African Americans by Child Poverty Under the Age of 16
In terms of child poverty under the age of 16, the demographic groups most similar to Blacks/African Americans are Houma (24.9%, a difference of 1.7%), Immigrants from Dominican Republic (24.0%, a difference of 2.0%), Pueblo (23.9%, a difference of 2.1%), Apache (23.8%, a difference of 2.5%), and Native/Alaskan (23.8%, a difference of 2.8%).
| Demographics | Rating | Rank | Child Poverty Under the Age of 16 |
| Menominee | 0.0 /100 | #327 | Tragic 23.0% |
| Colville | 0.0 /100 | #328 | Tragic 23.0% |
| Dominicans | 0.0 /100 | #329 | Tragic 23.8% |
| Natives/Alaskans | 0.0 /100 | #330 | Tragic 23.8% |
| Apache | 0.0 /100 | #331 | Tragic 23.8% |
| Pueblo | 0.0 /100 | #332 | Tragic 23.9% |
| Immigrants | Dominican Republic | 0.0 /100 | #333 | Tragic 24.0% |
| Blacks/African Americans | 0.0 /100 | #334 | Tragic 24.4% |
| Houma | 0.0 /100 | #335 | Tragic 24.9% |
| Yup'ik | 0.0 /100 | #336 | Tragic 25.1% |
| Sioux | 0.0 /100 | #337 | Tragic 25.2% |
| Cheyenne | 0.0 /100 | #338 | Tragic 25.4% |
| Crow | 0.0 /100 | #339 | Tragic 26.0% |
| Hopi | 0.0 /100 | #340 | Tragic 27.1% |
| Yuman | 0.0 /100 | #341 | Tragic 28.9% |
Demographics Similar to Immigrants by Child Poverty Under the Age of 16
In terms of child poverty under the age of 16, the demographic groups most similar to Immigrants are Immigrants from Thailand (17.5%, a difference of 0.020%), Alaskan Athabascan (17.5%, a difference of 0.15%), Panamanian (17.5%, a difference of 0.16%), Immigrants from the Azores (17.5%, a difference of 0.17%), and Iraqi (17.5%, a difference of 0.29%).
| Demographics | Rating | Rank | Child Poverty Under the Age of 16 |
| Aleuts | 13.9 /100 | #205 | Poor 17.1% |
| Alaska Natives | 11.8 /100 | #206 | Poor 17.2% |
| German Russians | 8.6 /100 | #207 | Tragic 17.4% |
| Pennsylvania Germans | 7.5 /100 | #208 | Tragic 17.4% |
| Panamanians | 6.9 /100 | #209 | Tragic 17.5% |
| Alaskan Athabascans | 6.9 /100 | #210 | Tragic 17.5% |
| Immigrants | Thailand | 6.6 /100 | #211 | Tragic 17.5% |
| Immigrants | Immigrants | 6.5 /100 | #212 | Tragic 17.5% |
| Immigrants | Azores | 6.2 /100 | #213 | Tragic 17.5% |
| Iraqis | 5.9 /100 | #214 | Tragic 17.5% |
| Malaysians | 5.9 /100 | #215 | Tragic 17.5% |
| Sierra Leoneans | 5.7 /100 | #216 | Tragic 17.6% |
| Immigrants | Eastern Africa | 5.3 /100 | #217 | Tragic 17.6% |
| Moroccans | 5.3 /100 | #218 | Tragic 17.6% |
| Japanese | 4.7 /100 | #219 | Tragic 17.7% |