Blackfeet vs Cypriot 2 or more Vehicles in Household
COMPARE
Blackfeet
Cypriot
2 or more Vehicles in Household
2 or more Vehicles in Household Comparison
Blackfeet
Cypriots
56.4%
2 OR MORE VEHICLES IN HOUSEHOLD
86.5/ 100
METRIC RATING
135th/ 347
METRIC RANK
50.6%
2 OR MORE VEHICLES IN HOUSEHOLD
0.0/ 100
METRIC RATING
295th/ 347
METRIC RANK
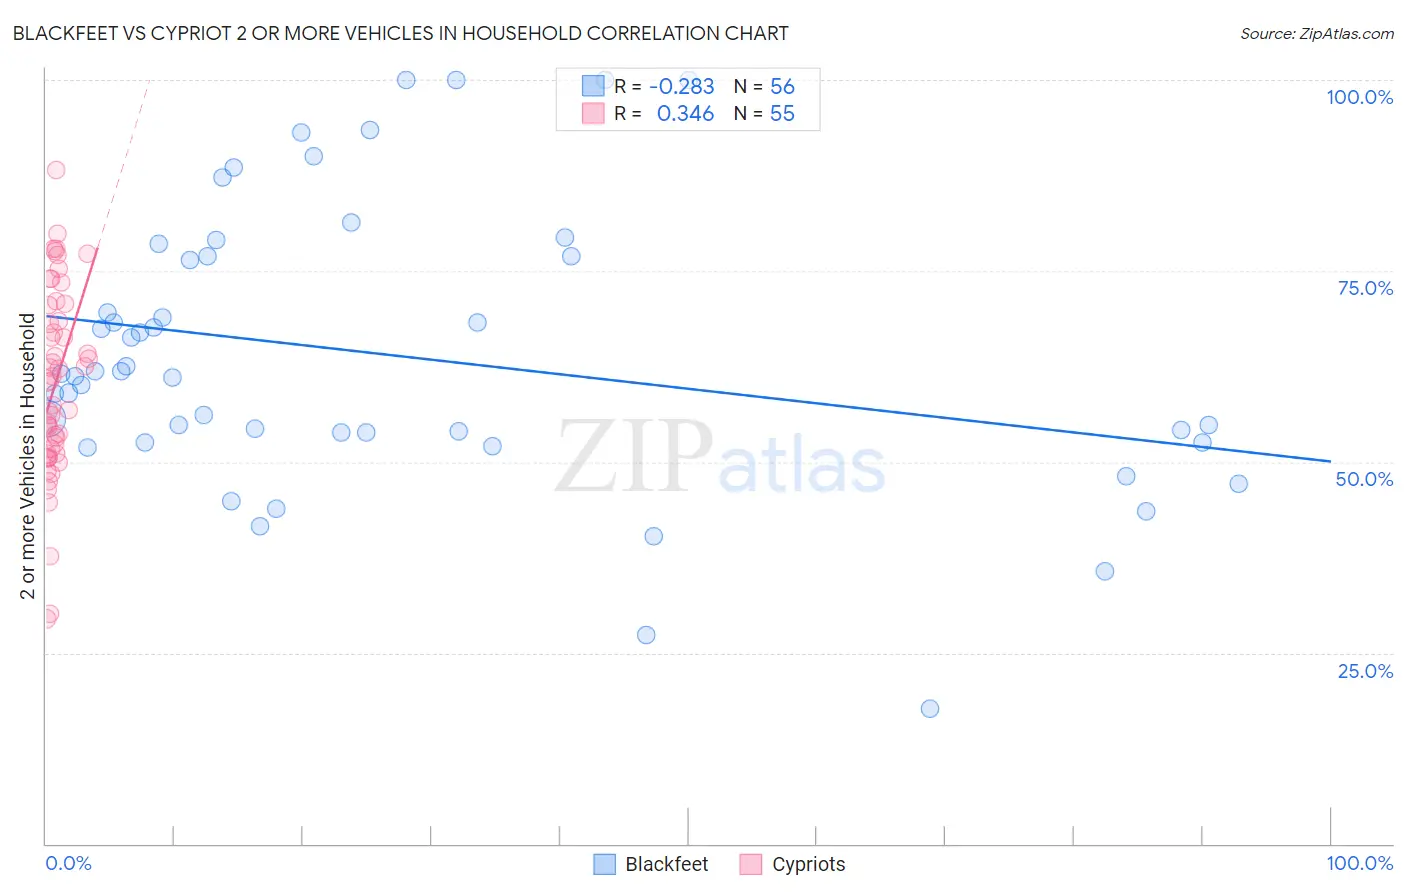
Blackfeet vs Cypriot 2 or more Vehicles in Household Correlation Chart
The statistical analysis conducted on geographies consisting of 309,483,449 people shows a weak negative correlation between the proportion of Blackfeet and percentage of households with 2 or more vehicles available in the United States with a correlation coefficient (R) of -0.283 and weighted average of 56.4%. Similarly, the statistical analysis conducted on geographies consisting of 61,854,678 people shows a mild positive correlation between the proportion of Cypriots and percentage of households with 2 or more vehicles available in the United States with a correlation coefficient (R) of 0.346 and weighted average of 50.6%, a difference of 11.5%.
2 or more Vehicles in Household Correlation Summary
| Measurement | Blackfeet | Cypriot |
| Minimum | 17.6% | 29.5% |
| Maximum | 100.0% | 88.3% |
| Range | 82.4% | 58.8% |
| Mean | 64.0% | 60.3% |
| Median | 61.3% | 60.5% |
| Interquartile 25% (IQ1) | 53.2% | 51.1% |
| Interquartile 75% (IQ3) | 76.8% | 70.5% |
| Interquartile Range (IQR) | 23.7% | 19.4% |
| Standard Deviation (Sample) | 18.5% | 12.4% |
| Standard Deviation (Population) | 18.3% | 12.3% |
Similar Demographics by 2 or more Vehicles in Household
Demographics Similar to Blackfeet by 2 or more Vehicles in Household
In terms of 2 or more vehicles in household, the demographic groups most similar to Blackfeet are Immigrants from the Azores (56.4%, a difference of 0.010%), Immigrants from Asia (56.3%, a difference of 0.040%), Cuban (56.3%, a difference of 0.13%), Salvadoran (56.3%, a difference of 0.14%), and Comanche (56.5%, a difference of 0.16%).
| Demographics | Rating | Rank | 2 or more Vehicles in Household |
| Immigrants | South Central Asia | 90.5 /100 | #128 | Exceptional 56.6% |
| Ute | 90.4 /100 | #129 | Exceptional 56.6% |
| Yugoslavians | 90.0 /100 | #130 | Exceptional 56.6% |
| Bulgarians | 89.7 /100 | #131 | Excellent 56.5% |
| Hungarians | 89.1 /100 | #132 | Excellent 56.5% |
| Comanche | 88.4 /100 | #133 | Excellent 56.5% |
| Immigrants | Azores | 86.6 /100 | #134 | Excellent 56.4% |
| Blackfeet | 86.5 /100 | #135 | Excellent 56.4% |
| Immigrants | Asia | 86.0 /100 | #136 | Excellent 56.3% |
| Cubans | 84.8 /100 | #137 | Excellent 56.3% |
| Salvadorans | 84.7 /100 | #138 | Excellent 56.3% |
| Armenians | 84.3 /100 | #139 | Excellent 56.3% |
| Latvians | 83.6 /100 | #140 | Excellent 56.2% |
| Immigrants | Cambodia | 83.6 /100 | #141 | Excellent 56.2% |
| South Africans | 83.1 /100 | #142 | Excellent 56.2% |
Demographics Similar to Cypriots by 2 or more Vehicles in Household
In terms of 2 or more vehicles in household, the demographic groups most similar to Cypriots are Immigrants from Somalia (50.5%, a difference of 0.040%), Bermudan (50.6%, a difference of 0.070%), Immigrants from Spain (50.4%, a difference of 0.31%), Paraguayan (50.3%, a difference of 0.44%), and Immigrants from Morocco (50.3%, a difference of 0.47%).
| Demographics | Rating | Rank | 2 or more Vehicles in Household |
| Okinawans | 0.1 /100 | #288 | Tragic 51.2% |
| Somalis | 0.0 /100 | #289 | Tragic 51.1% |
| Immigrants | Panama | 0.0 /100 | #290 | Tragic 51.1% |
| Belizeans | 0.0 /100 | #291 | Tragic 51.0% |
| Immigrants | Ukraine | 0.0 /100 | #292 | Tragic 50.9% |
| Blacks/African Americans | 0.0 /100 | #293 | Tragic 50.9% |
| Bermudans | 0.0 /100 | #294 | Tragic 50.6% |
| Cypriots | 0.0 /100 | #295 | Tragic 50.6% |
| Immigrants | Somalia | 0.0 /100 | #296 | Tragic 50.5% |
| Immigrants | Spain | 0.0 /100 | #297 | Tragic 50.4% |
| Paraguayans | 0.0 /100 | #298 | Tragic 50.3% |
| Immigrants | Morocco | 0.0 /100 | #299 | Tragic 50.3% |
| Immigrants | Russia | 0.0 /100 | #300 | Tragic 50.3% |
| Immigrants | Greece | 0.0 /100 | #301 | Tragic 50.2% |
| Immigrants | South America | 0.0 /100 | #302 | Tragic 50.2% |