Blackfeet vs Laotian 2 or more Vehicles in Household
COMPARE
Blackfeet
Laotian
2 or more Vehicles in Household
2 or more Vehicles in Household Comparison
Blackfeet
Laotians
56.4%
2 OR MORE VEHICLES IN HOUSEHOLD
86.5/ 100
METRIC RATING
135th/ 347
METRIC RANK
58.6%
2 OR MORE VEHICLES IN HOUSEHOLD
99.7/ 100
METRIC RATING
67th/ 347
METRIC RANK
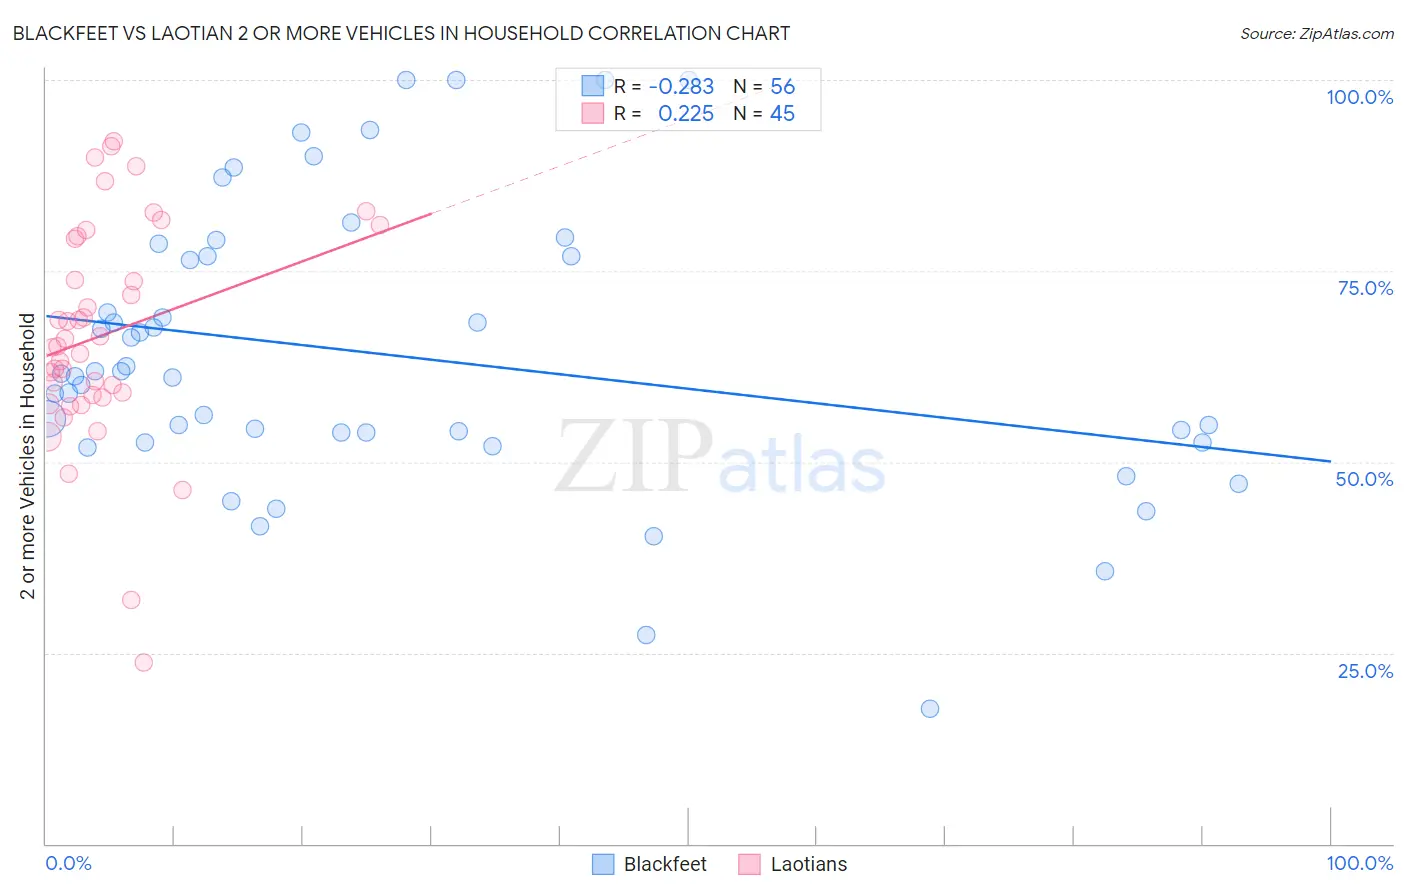
Blackfeet vs Laotian 2 or more Vehicles in Household Correlation Chart
The statistical analysis conducted on geographies consisting of 309,483,449 people shows a weak negative correlation between the proportion of Blackfeet and percentage of households with 2 or more vehicles available in the United States with a correlation coefficient (R) of -0.283 and weighted average of 56.4%. Similarly, the statistical analysis conducted on geographies consisting of 224,647,130 people shows a weak positive correlation between the proportion of Laotians and percentage of households with 2 or more vehicles available in the United States with a correlation coefficient (R) of 0.225 and weighted average of 58.6%, a difference of 3.9%.
2 or more Vehicles in Household Correlation Summary
| Measurement | Blackfeet | Laotian |
| Minimum | 17.6% | 23.7% |
| Maximum | 100.0% | 91.9% |
| Range | 82.4% | 68.2% |
| Mean | 64.0% | 66.6% |
| Median | 61.3% | 65.2% |
| Interquartile 25% (IQ1) | 53.2% | 58.6% |
| Interquartile 75% (IQ3) | 76.8% | 79.4% |
| Interquartile Range (IQR) | 23.7% | 20.8% |
| Standard Deviation (Sample) | 18.5% | 14.5% |
| Standard Deviation (Population) | 18.3% | 14.3% |
Similar Demographics by 2 or more Vehicles in Household
Demographics Similar to Blackfeet by 2 or more Vehicles in Household
In terms of 2 or more vehicles in household, the demographic groups most similar to Blackfeet are Immigrants from the Azores (56.4%, a difference of 0.010%), Immigrants from Asia (56.3%, a difference of 0.040%), Cuban (56.3%, a difference of 0.13%), Salvadoran (56.3%, a difference of 0.14%), and Comanche (56.5%, a difference of 0.16%).
| Demographics | Rating | Rank | 2 or more Vehicles in Household |
| Immigrants | South Central Asia | 90.5 /100 | #128 | Exceptional 56.6% |
| Ute | 90.4 /100 | #129 | Exceptional 56.6% |
| Yugoslavians | 90.0 /100 | #130 | Exceptional 56.6% |
| Bulgarians | 89.7 /100 | #131 | Excellent 56.5% |
| Hungarians | 89.1 /100 | #132 | Excellent 56.5% |
| Comanche | 88.4 /100 | #133 | Excellent 56.5% |
| Immigrants | Azores | 86.6 /100 | #134 | Excellent 56.4% |
| Blackfeet | 86.5 /100 | #135 | Excellent 56.4% |
| Immigrants | Asia | 86.0 /100 | #136 | Excellent 56.3% |
| Cubans | 84.8 /100 | #137 | Excellent 56.3% |
| Salvadorans | 84.7 /100 | #138 | Excellent 56.3% |
| Armenians | 84.3 /100 | #139 | Excellent 56.3% |
| Latvians | 83.6 /100 | #140 | Excellent 56.2% |
| Immigrants | Cambodia | 83.6 /100 | #141 | Excellent 56.2% |
| South Africans | 83.1 /100 | #142 | Excellent 56.2% |
Demographics Similar to Laotians by 2 or more Vehicles in Household
In terms of 2 or more vehicles in household, the demographic groups most similar to Laotians are Canadian (58.6%, a difference of 0.010%), Immigrants from Central America (58.6%, a difference of 0.020%), Croatian (58.6%, a difference of 0.020%), Portuguese (58.6%, a difference of 0.070%), and Pennsylvania German (58.5%, a difference of 0.13%).
| Demographics | Rating | Rank | 2 or more Vehicles in Household |
| French Canadians | 99.8 /100 | #60 | Exceptional 58.9% |
| Osage | 99.8 /100 | #61 | Exceptional 58.8% |
| Immigrants | Nonimmigrants | 99.8 /100 | #62 | Exceptional 58.8% |
| Mexican American Indians | 99.8 /100 | #63 | Exceptional 58.7% |
| Portuguese | 99.7 /100 | #64 | Exceptional 58.6% |
| Immigrants | Central America | 99.7 /100 | #65 | Exceptional 58.6% |
| Croatians | 99.7 /100 | #66 | Exceptional 58.6% |
| Laotians | 99.7 /100 | #67 | Exceptional 58.6% |
| Canadians | 99.7 /100 | #68 | Exceptional 58.6% |
| Pennsylvania Germans | 99.7 /100 | #69 | Exceptional 58.5% |
| Italians | 99.6 /100 | #70 | Exceptional 58.4% |
| Bangladeshis | 99.6 /100 | #71 | Exceptional 58.4% |
| Austrians | 99.6 /100 | #72 | Exceptional 58.4% |
| Bolivians | 99.6 /100 | #73 | Exceptional 58.3% |
| Immigrants | Afghanistan | 99.6 /100 | #74 | Exceptional 58.3% |