Blackfeet vs British 2 or more Vehicles in Household
COMPARE
Blackfeet
British
2 or more Vehicles in Household
2 or more Vehicles in Household Comparison
Blackfeet
British
56.4%
2 OR MORE VEHICLES IN HOUSEHOLD
86.5/ 100
METRIC RATING
135th/ 347
METRIC RANK
60.0%
2 OR MORE VEHICLES IN HOUSEHOLD
100.0/ 100
METRIC RATING
39th/ 347
METRIC RANK
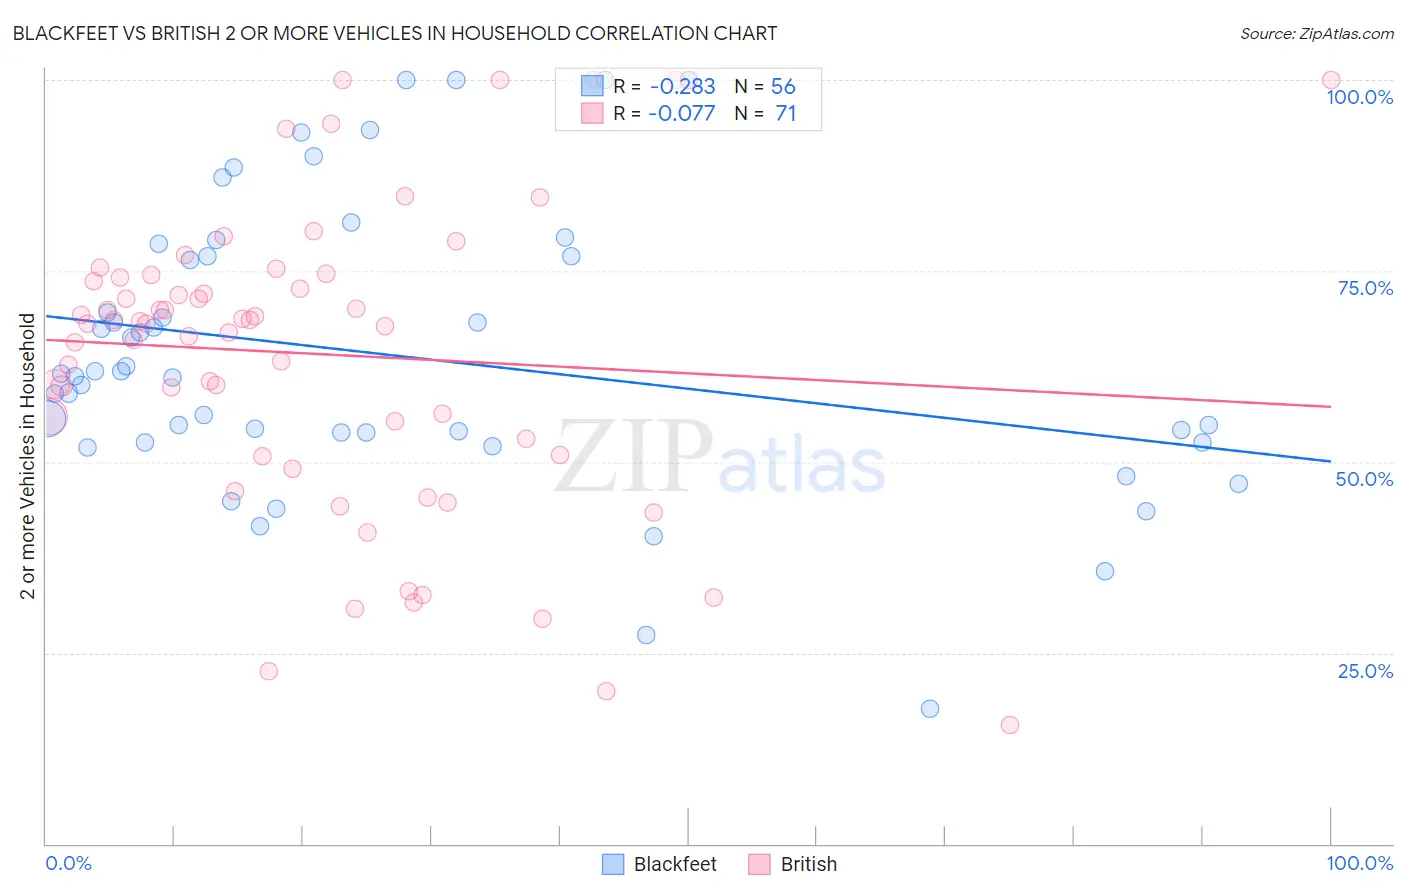
Blackfeet vs British 2 or more Vehicles in Household Correlation Chart
The statistical analysis conducted on geographies consisting of 309,483,449 people shows a weak negative correlation between the proportion of Blackfeet and percentage of households with 2 or more vehicles available in the United States with a correlation coefficient (R) of -0.283 and weighted average of 56.4%. Similarly, the statistical analysis conducted on geographies consisting of 531,069,536 people shows a slight negative correlation between the proportion of British and percentage of households with 2 or more vehicles available in the United States with a correlation coefficient (R) of -0.077 and weighted average of 60.0%, a difference of 6.5%.
2 or more Vehicles in Household Correlation Summary
| Measurement | Blackfeet | British |
| Minimum | 17.6% | 15.6% |
| Maximum | 100.0% | 100.0% |
| Range | 82.4% | 84.4% |
| Mean | 64.0% | 64.1% |
| Median | 61.3% | 68.1% |
| Interquartile 25% (IQ1) | 53.2% | 50.8% |
| Interquartile 75% (IQ3) | 76.8% | 74.5% |
| Interquartile Range (IQR) | 23.7% | 23.7% |
| Standard Deviation (Sample) | 18.5% | 20.1% |
| Standard Deviation (Population) | 18.3% | 20.0% |
Similar Demographics by 2 or more Vehicles in Household
Demographics Similar to Blackfeet by 2 or more Vehicles in Household
In terms of 2 or more vehicles in household, the demographic groups most similar to Blackfeet are Immigrants from the Azores (56.4%, a difference of 0.010%), Immigrants from Asia (56.3%, a difference of 0.040%), Cuban (56.3%, a difference of 0.13%), Salvadoran (56.3%, a difference of 0.14%), and Comanche (56.5%, a difference of 0.16%).
| Demographics | Rating | Rank | 2 or more Vehicles in Household |
| Immigrants | South Central Asia | 90.5 /100 | #128 | Exceptional 56.6% |
| Ute | 90.4 /100 | #129 | Exceptional 56.6% |
| Yugoslavians | 90.0 /100 | #130 | Exceptional 56.6% |
| Bulgarians | 89.7 /100 | #131 | Excellent 56.5% |
| Hungarians | 89.1 /100 | #132 | Excellent 56.5% |
| Comanche | 88.4 /100 | #133 | Excellent 56.5% |
| Immigrants | Azores | 86.6 /100 | #134 | Excellent 56.4% |
| Blackfeet | 86.5 /100 | #135 | Excellent 56.4% |
| Immigrants | Asia | 86.0 /100 | #136 | Excellent 56.3% |
| Cubans | 84.8 /100 | #137 | Excellent 56.3% |
| Salvadorans | 84.7 /100 | #138 | Excellent 56.3% |
| Armenians | 84.3 /100 | #139 | Excellent 56.3% |
| Latvians | 83.6 /100 | #140 | Excellent 56.2% |
| Immigrants | Cambodia | 83.6 /100 | #141 | Excellent 56.2% |
| South Africans | 83.1 /100 | #142 | Excellent 56.2% |
Demographics Similar to British by 2 or more Vehicles in Household
In terms of 2 or more vehicles in household, the demographic groups most similar to British are American (60.0%, a difference of 0.0%), Irish (60.1%, a difference of 0.070%), Chinese (60.1%, a difference of 0.10%), Immigrants from Philippines (60.1%, a difference of 0.12%), and Spanish (60.2%, a difference of 0.25%).
| Demographics | Rating | Rank | 2 or more Vehicles in Household |
| Arapaho | 100.0 /100 | #32 | Exceptional 60.2% |
| Immigrants | Mexico | 100.0 /100 | #33 | Exceptional 60.2% |
| Spanish | 100.0 /100 | #34 | Exceptional 60.2% |
| Immigrants | Philippines | 100.0 /100 | #35 | Exceptional 60.1% |
| Chinese | 100.0 /100 | #36 | Exceptional 60.1% |
| Irish | 100.0 /100 | #37 | Exceptional 60.1% |
| Americans | 100.0 /100 | #38 | Exceptional 60.0% |
| British | 100.0 /100 | #39 | Exceptional 60.0% |
| Cherokee | 100.0 /100 | #40 | Exceptional 59.9% |
| Northern Europeans | 100.0 /100 | #41 | Exceptional 59.9% |
| Malaysians | 100.0 /100 | #42 | Exceptional 59.8% |
| Czechoslovakians | 100.0 /100 | #43 | Exceptional 59.8% |
| French | 100.0 /100 | #44 | Exceptional 59.8% |
| Immigrants | Taiwan | 100.0 /100 | #45 | Exceptional 59.7% |
| Immigrants | South Eastern Asia | 100.0 /100 | #46 | Exceptional 59.6% |