Bhutanese vs French 2 or more Vehicles in Household
COMPARE
Bhutanese
French
2 or more Vehicles in Household
2 or more Vehicles in Household Comparison
Bhutanese
French
59.1%
2 OR MORE VEHICLES IN HOUSEHOLD
99.9/ 100
METRIC RATING
54th/ 347
METRIC RANK
59.8%
2 OR MORE VEHICLES IN HOUSEHOLD
100.0/ 100
METRIC RATING
44th/ 347
METRIC RANK
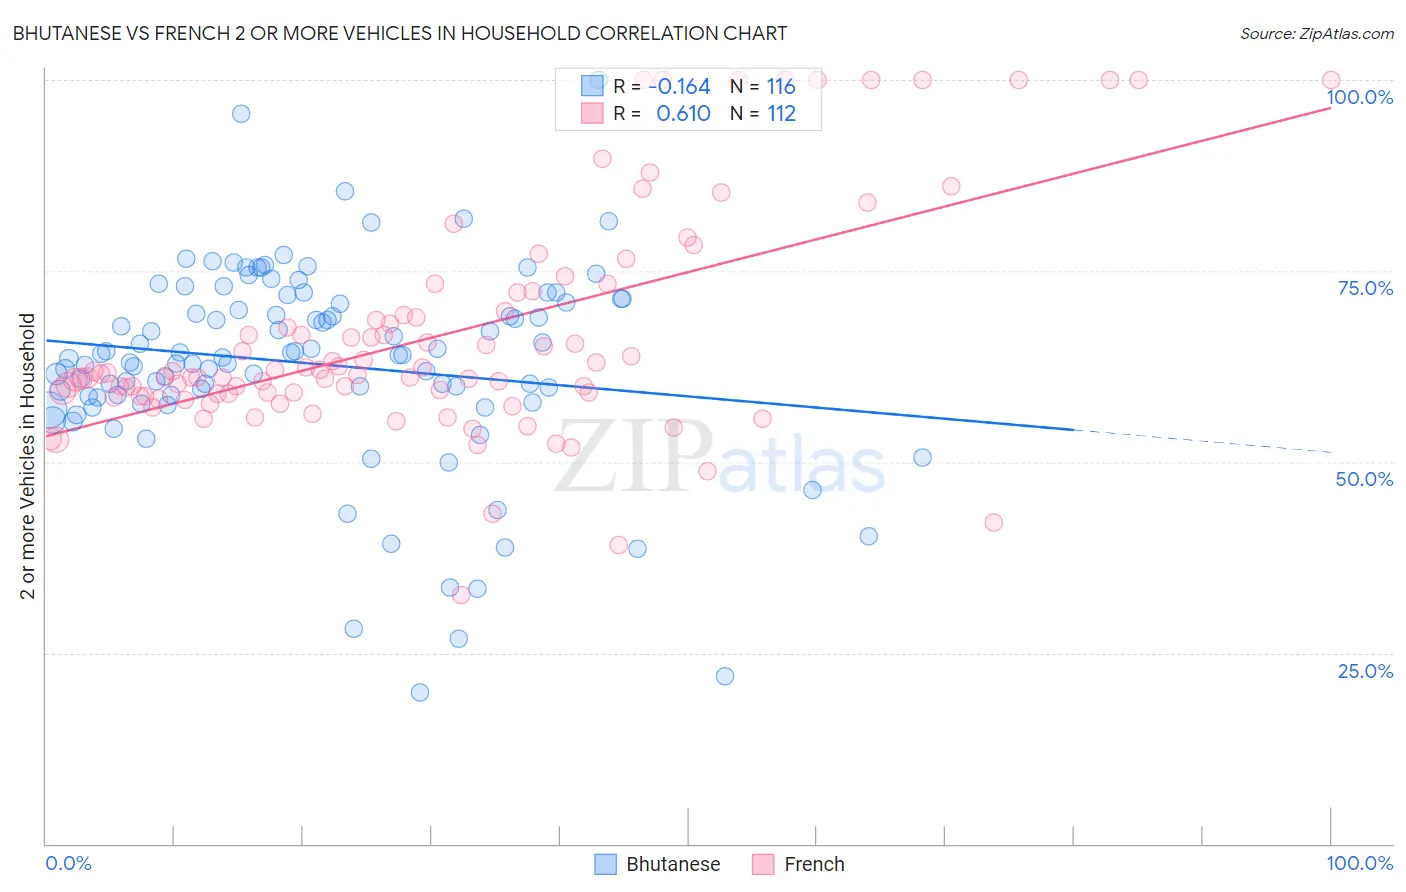
Bhutanese vs French 2 or more Vehicles in Household Correlation Chart
The statistical analysis conducted on geographies consisting of 455,207,959 people shows a poor negative correlation between the proportion of Bhutanese and percentage of households with 2 or more vehicles available in the United States with a correlation coefficient (R) of -0.164 and weighted average of 59.1%. Similarly, the statistical analysis conducted on geographies consisting of 571,870,956 people shows a significant positive correlation between the proportion of French and percentage of households with 2 or more vehicles available in the United States with a correlation coefficient (R) of 0.610 and weighted average of 59.8%, a difference of 1.2%.
2 or more Vehicles in Household Correlation Summary
| Measurement | Bhutanese | French |
| Minimum | 19.7% | 32.5% |
| Maximum | 100.0% | 100.0% |
| Range | 80.3% | 67.5% |
| Mean | 62.8% | 66.4% |
| Median | 63.8% | 61.5% |
| Interquartile 25% (IQ1) | 58.5% | 58.8% |
| Interquartile 75% (IQ3) | 71.1% | 69.5% |
| Interquartile Range (IQR) | 12.6% | 10.7% |
| Standard Deviation (Sample) | 13.2% | 14.5% |
| Standard Deviation (Population) | 13.1% | 14.4% |
Demographics Similar to Bhutanese and French by 2 or more Vehicles in Household
In terms of 2 or more vehicles in household, the demographic groups most similar to Bhutanese are Luxembourger (59.1%, a difference of 0.030%), Celtic (59.2%, a difference of 0.14%), Chickasaw (59.0%, a difference of 0.14%), Afghan (59.0%, a difference of 0.14%), and Spaniard (59.2%, a difference of 0.16%). Similarly, the demographic groups most similar to French are Immigrants from Taiwan (59.7%, a difference of 0.040%), Czechoslovakian (59.8%, a difference of 0.060%), Malaysian (59.8%, a difference of 0.14%), Northern European (59.9%, a difference of 0.15%), and Cherokee (59.9%, a difference of 0.17%).
| Demographics | Rating | Rank | 2 or more Vehicles in Household |
| British | 100.0 /100 | #39 | Exceptional 60.0% |
| Cherokee | 100.0 /100 | #40 | Exceptional 59.9% |
| Northern Europeans | 100.0 /100 | #41 | Exceptional 59.9% |
| Malaysians | 100.0 /100 | #42 | Exceptional 59.8% |
| Czechoslovakians | 100.0 /100 | #43 | Exceptional 59.8% |
| French | 100.0 /100 | #44 | Exceptional 59.8% |
| Immigrants | Taiwan | 100.0 /100 | #45 | Exceptional 59.7% |
| Immigrants | South Eastern Asia | 100.0 /100 | #46 | Exceptional 59.6% |
| Yaqui | 99.9 /100 | #47 | Exceptional 59.3% |
| Immigrants | India | 99.9 /100 | #48 | Exceptional 59.3% |
| Belgians | 99.9 /100 | #49 | Exceptional 59.3% |
| Choctaw | 99.9 /100 | #50 | Exceptional 59.3% |
| Spaniards | 99.9 /100 | #51 | Exceptional 59.2% |
| Immigrants | Laos | 99.9 /100 | #52 | Exceptional 59.2% |
| Celtics | 99.9 /100 | #53 | Exceptional 59.2% |
| Bhutanese | 99.9 /100 | #54 | Exceptional 59.1% |
| Luxembourgers | 99.9 /100 | #55 | Exceptional 59.1% |
| Chickasaw | 99.9 /100 | #56 | Exceptional 59.0% |
| Afghans | 99.9 /100 | #57 | Exceptional 59.0% |
| Immigrants | Scotland | 99.8 /100 | #58 | Exceptional 58.9% |
| Spanish Americans | 99.8 /100 | #59 | Exceptional 58.9% |