Bhutanese vs Immigrants from Turkey Hearing Disability
COMPARE
Bhutanese
Immigrants from Turkey
Hearing Disability
Hearing Disability Comparison
Bhutanese
Immigrants from Turkey
3.2%
HEARING DISABILITY
4.6/ 100
METRIC RATING
227th/ 347
METRIC RANK
2.8%
HEARING DISABILITY
96.7/ 100
METRIC RATING
88th/ 347
METRIC RANK
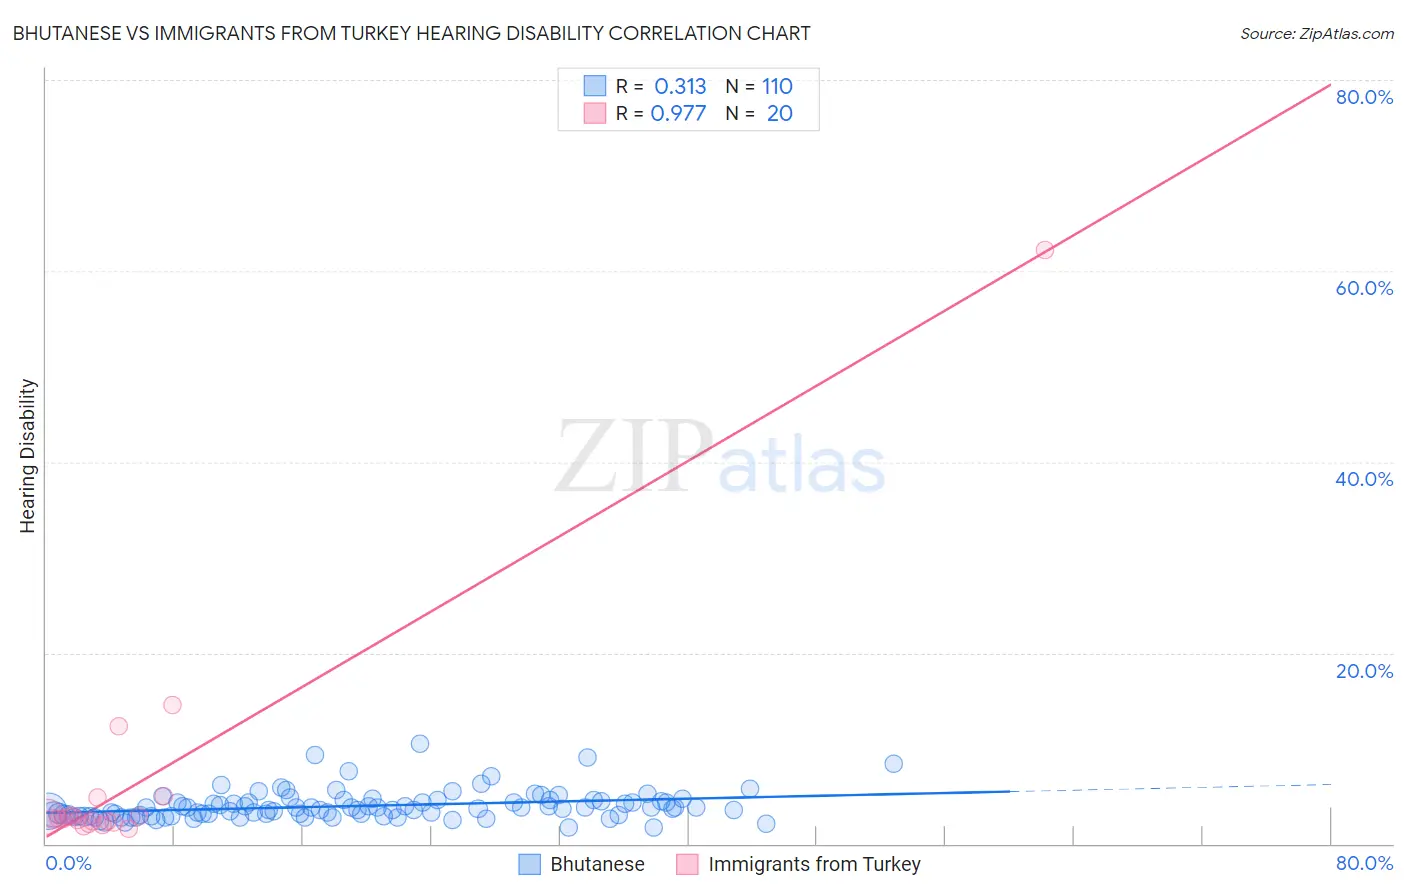
Bhutanese vs Immigrants from Turkey Hearing Disability Correlation Chart
The statistical analysis conducted on geographies consisting of 455,292,805 people shows a mild positive correlation between the proportion of Bhutanese and percentage of population with hearing disability in the United States with a correlation coefficient (R) of 0.313 and weighted average of 3.2%. Similarly, the statistical analysis conducted on geographies consisting of 223,029,530 people shows a perfect positive correlation between the proportion of Immigrants from Turkey and percentage of population with hearing disability in the United States with a correlation coefficient (R) of 0.977 and weighted average of 2.8%, a difference of 16.3%.
Hearing Disability Correlation Summary
| Measurement | Bhutanese | Immigrants from Turkey |
| Minimum | 1.7% | 1.5% |
| Maximum | 10.5% | 62.2% |
| Range | 8.8% | 60.6% |
| Mean | 4.0% | 6.8% |
| Median | 3.7% | 2.7% |
| Interquartile 25% (IQ1) | 3.0% | 2.3% |
| Interquartile 75% (IQ3) | 4.4% | 3.9% |
| Interquartile Range (IQR) | 1.5% | 1.5% |
| Standard Deviation (Sample) | 1.5% | 13.5% |
| Standard Deviation (Population) | 1.5% | 13.1% |
Similar Demographics by Hearing Disability
Demographics Similar to Bhutanese by Hearing Disability
In terms of hearing disability, the demographic groups most similar to Bhutanese are Lebanese (3.2%, a difference of 0.18%), Immigrants from Portugal (3.2%, a difference of 0.20%), Latvian (3.2%, a difference of 0.23%), Icelander (3.2%, a difference of 0.27%), and Maltese (3.2%, a difference of 0.30%).
| Demographics | Rating | Rank | Hearing Disability |
| Malaysians | 6.6 /100 | #220 | Tragic 3.2% |
| Immigrants | Laos | 6.6 /100 | #221 | Tragic 3.2% |
| Immigrants | Oceania | 6.5 /100 | #222 | Tragic 3.2% |
| Mexicans | 5.6 /100 | #223 | Tragic 3.2% |
| Icelanders | 5.2 /100 | #224 | Tragic 3.2% |
| Latvians | 5.1 /100 | #225 | Tragic 3.2% |
| Lebanese | 5.0 /100 | #226 | Tragic 3.2% |
| Bhutanese | 4.6 /100 | #227 | Tragic 3.2% |
| Immigrants | Portugal | 4.3 /100 | #228 | Tragic 3.2% |
| Maltese | 4.1 /100 | #229 | Tragic 3.2% |
| Greeks | 3.2 /100 | #230 | Tragic 3.2% |
| Luxembourgers | 2.9 /100 | #231 | Tragic 3.2% |
| Ukrainians | 2.9 /100 | #232 | Tragic 3.2% |
| Estonians | 2.4 /100 | #233 | Tragic 3.3% |
| Central American Indians | 2.3 /100 | #234 | Tragic 3.3% |
Demographics Similar to Immigrants from Turkey by Hearing Disability
In terms of hearing disability, the demographic groups most similar to Immigrants from Turkey are Belizean (2.8%, a difference of 0.030%), Somali (2.8%, a difference of 0.040%), Immigrants from Morocco (2.8%, a difference of 0.050%), Immigrants from Middle Africa (2.8%, a difference of 0.13%), and Immigrants from Iran (2.8%, a difference of 0.14%).
| Demographics | Rating | Rank | Hearing Disability |
| Immigrants | Uruguay | 97.2 /100 | #81 | Exceptional 2.7% |
| Immigrants | Armenia | 97.2 /100 | #82 | Exceptional 2.7% |
| Immigrants | Cuba | 97.2 /100 | #83 | Exceptional 2.7% |
| Immigrants | Argentina | 97.0 /100 | #84 | Exceptional 2.8% |
| Immigrants | Northern Africa | 96.9 /100 | #85 | Exceptional 2.8% |
| Immigrants | Iran | 96.8 /100 | #86 | Exceptional 2.8% |
| Somalis | 96.7 /100 | #87 | Exceptional 2.8% |
| Immigrants | Turkey | 96.7 /100 | #88 | Exceptional 2.8% |
| Belizeans | 96.6 /100 | #89 | Exceptional 2.8% |
| Immigrants | Morocco | 96.6 /100 | #90 | Exceptional 2.8% |
| Immigrants | Middle Africa | 96.5 /100 | #91 | Exceptional 2.8% |
| Iranians | 96.4 /100 | #92 | Exceptional 2.8% |
| Immigrants | Kuwait | 96.3 /100 | #93 | Exceptional 2.8% |
| Uruguayans | 95.9 /100 | #94 | Exceptional 2.8% |
| Israelis | 95.9 /100 | #95 | Exceptional 2.8% |