Belgian vs Macedonian Single Father Poverty
COMPARE
Belgian
Macedonian
Single Father Poverty
Single Father Poverty Comparison
Belgians
Macedonians
16.8%
SINGLE FATHER POVERTY
5.3/ 100
METRIC RATING
228th/ 347
METRIC RANK
17.7%
SINGLE FATHER POVERTY
0.1/ 100
METRIC RATING
274th/ 347
METRIC RANK
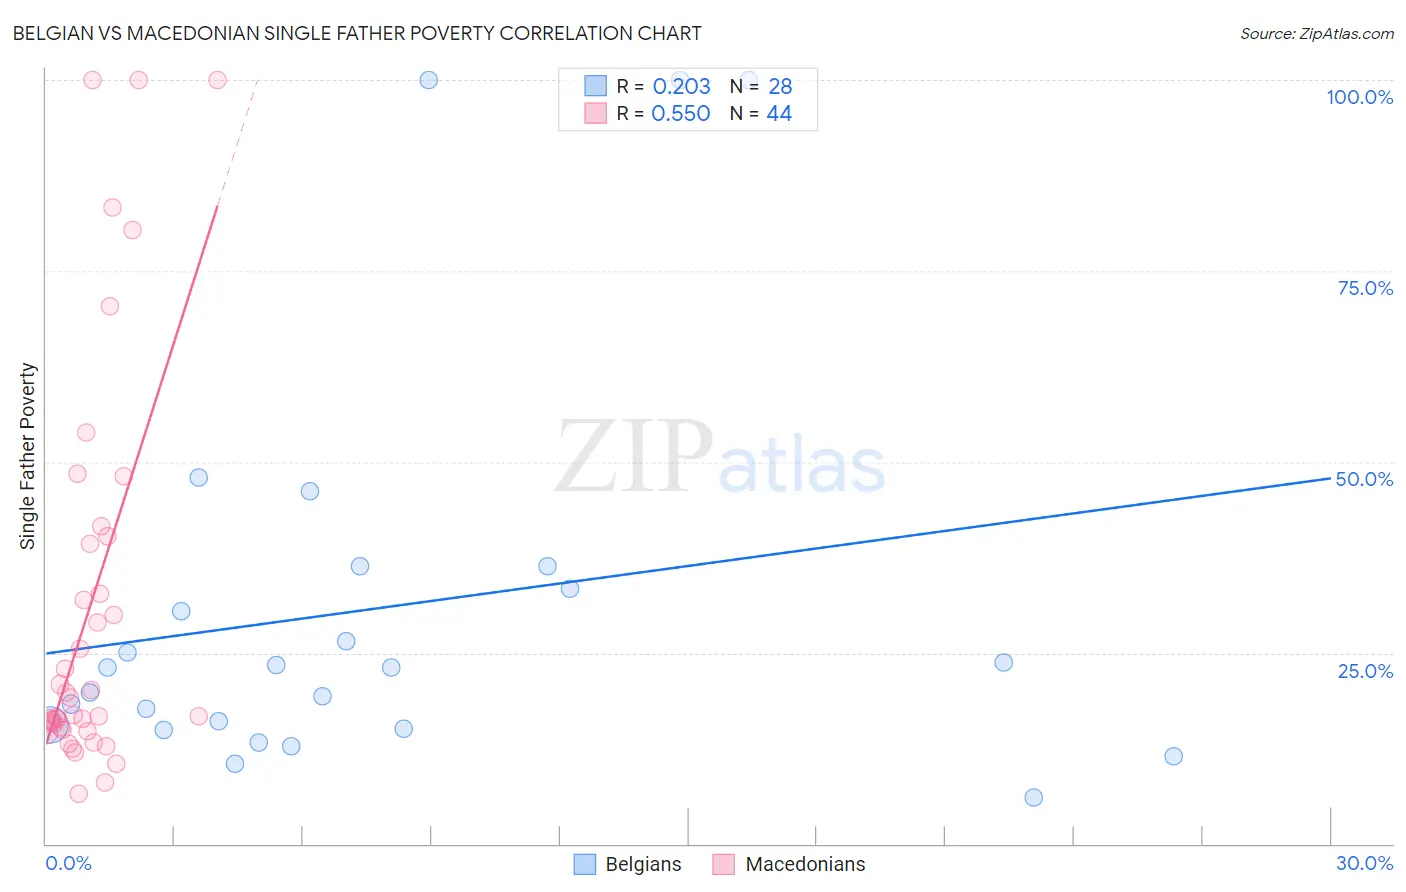
Belgian vs Macedonian Single Father Poverty Correlation Chart
The statistical analysis conducted on geographies consisting of 276,929,411 people shows a weak positive correlation between the proportion of Belgians and poverty level among single fathers in the United States with a correlation coefficient (R) of 0.203 and weighted average of 16.8%. Similarly, the statistical analysis conducted on geographies consisting of 112,665,008 people shows a substantial positive correlation between the proportion of Macedonians and poverty level among single fathers in the United States with a correlation coefficient (R) of 0.550 and weighted average of 17.7%, a difference of 5.0%.
Single Father Poverty Correlation Summary
| Measurement | Belgian | Macedonian |
| Minimum | 6.1% | 6.6% |
| Maximum | 100.0% | 100.0% |
| Range | 93.9% | 93.4% |
| Mean | 30.9% | 31.1% |
| Median | 23.0% | 18.0% |
| Interquartile 25% (IQ1) | 15.3% | 15.0% |
| Interquartile 75% (IQ3) | 34.8% | 39.8% |
| Interquartile Range (IQR) | 19.6% | 24.8% |
| Standard Deviation (Sample) | 26.4% | 26.1% |
| Standard Deviation (Population) | 25.9% | 25.8% |
Similar Demographics by Single Father Poverty
Demographics Similar to Belgians by Single Father Poverty
In terms of single father poverty, the demographic groups most similar to Belgians are British (16.8%, a difference of 0.070%), Hispanic or Latino (16.8%, a difference of 0.16%), Israeli (16.8%, a difference of 0.16%), Immigrants from Trinidad and Tobago (16.8%, a difference of 0.19%), and Menominee (16.8%, a difference of 0.21%).
| Demographics | Rating | Rank | Single Father Poverty |
| Immigrants | Greece | 8.1 /100 | #221 | Tragic 16.7% |
| Immigrants | Spain | 8.0 /100 | #222 | Tragic 16.7% |
| Immigrants | Austria | 7.0 /100 | #223 | Tragic 16.8% |
| Immigrants | Norway | 6.5 /100 | #224 | Tragic 16.8% |
| Menominee | 6.4 /100 | #225 | Tragic 16.8% |
| Hispanics or Latinos | 6.1 /100 | #226 | Tragic 16.8% |
| British | 5.6 /100 | #227 | Tragic 16.8% |
| Belgians | 5.3 /100 | #228 | Tragic 16.8% |
| Israelis | 4.6 /100 | #229 | Tragic 16.8% |
| Immigrants | Trinidad and Tobago | 4.5 /100 | #230 | Tragic 16.8% |
| Spanish Americans | 3.7 /100 | #231 | Tragic 16.9% |
| Immigrants | Grenada | 3.7 /100 | #232 | Tragic 16.9% |
| Senegalese | 3.2 /100 | #233 | Tragic 16.9% |
| Marshallese | 3.1 /100 | #234 | Tragic 16.9% |
| Immigrants | Western Europe | 2.9 /100 | #235 | Tragic 16.9% |
Demographics Similar to Macedonians by Single Father Poverty
In terms of single father poverty, the demographic groups most similar to Macedonians are British West Indian (17.7%, a difference of 0.070%), German Russian (17.7%, a difference of 0.13%), Lebanese (17.7%, a difference of 0.28%), German (17.7%, a difference of 0.29%), and Iroquois (17.7%, a difference of 0.43%).
| Demographics | Rating | Rank | Single Father Poverty |
| Haitians | 0.3 /100 | #267 | Tragic 17.3% |
| Immigrants | Caribbean | 0.3 /100 | #268 | Tragic 17.4% |
| Slavs | 0.3 /100 | #269 | Tragic 17.4% |
| Indonesians | 0.2 /100 | #270 | Tragic 17.4% |
| French American Indians | 0.2 /100 | #271 | Tragic 17.4% |
| Barbadians | 0.1 /100 | #272 | Tragic 17.5% |
| Italians | 0.1 /100 | #273 | Tragic 17.5% |
| Macedonians | 0.1 /100 | #274 | Tragic 17.7% |
| British West Indians | 0.0 /100 | #275 | Tragic 17.7% |
| German Russians | 0.0 /100 | #276 | Tragic 17.7% |
| Lebanese | 0.0 /100 | #277 | Tragic 17.7% |
| Germans | 0.0 /100 | #278 | Tragic 17.7% |
| Iroquois | 0.0 /100 | #279 | Tragic 17.7% |
| Scottish | 0.0 /100 | #280 | Tragic 17.7% |
| English | 0.0 /100 | #281 | Tragic 17.8% |