Belgian vs Macedonian Master's Degree
COMPARE
Belgian
Macedonian
Master's Degree
Master's Degree Comparison
Belgians
Macedonians
14.5%
MASTER'S DEGREE
28.0/ 100
METRIC RATING
197th/ 347
METRIC RANK
16.7%
MASTER'S DEGREE
97.7/ 100
METRIC RATING
112th/ 347
METRIC RANK
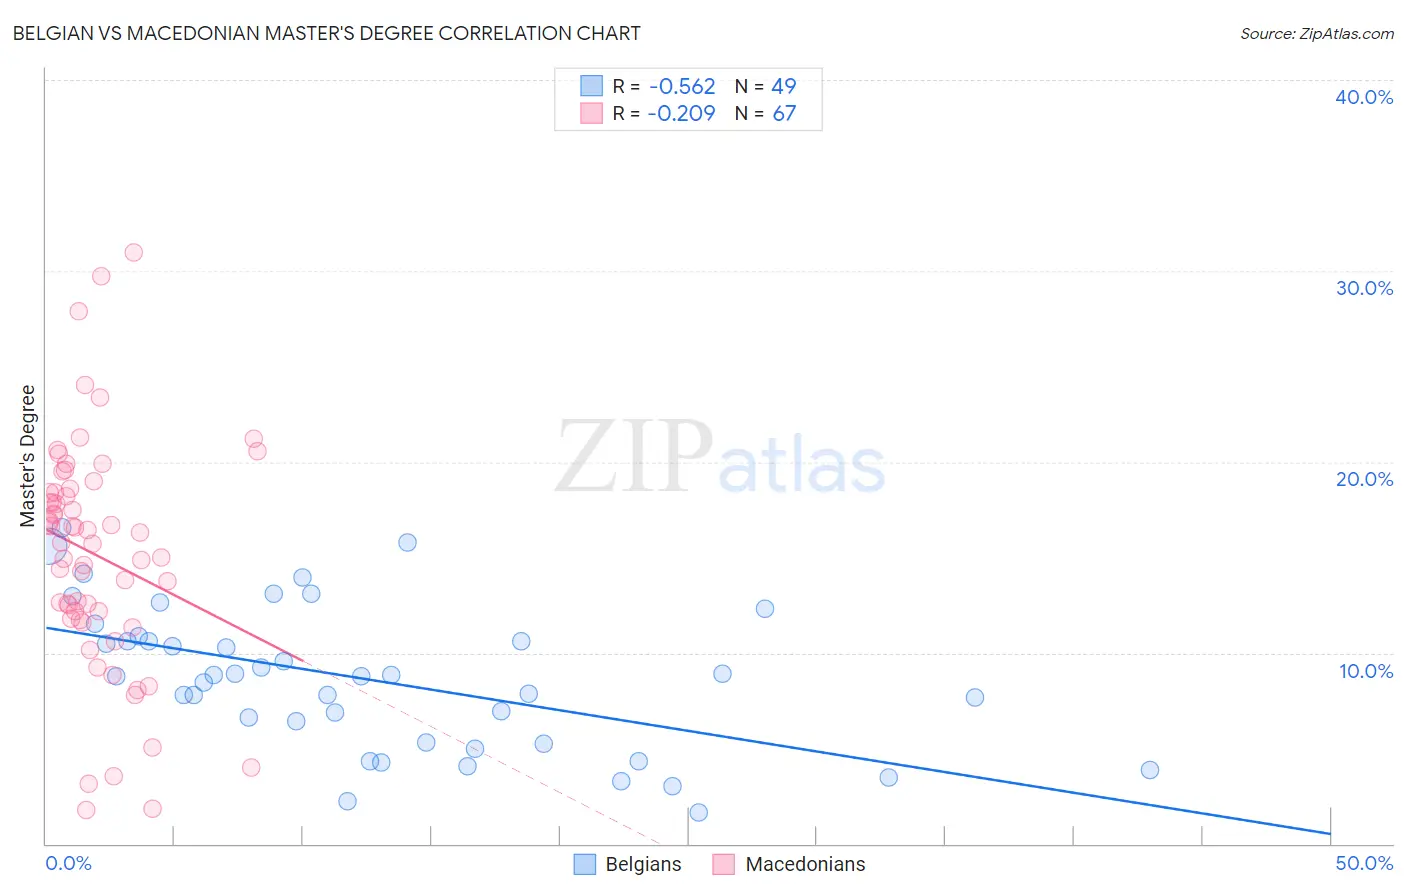
Belgian vs Macedonian Master's Degree Correlation Chart
The statistical analysis conducted on geographies consisting of 355,911,624 people shows a substantial negative correlation between the proportion of Belgians and percentage of population with at least master's degree education in the United States with a correlation coefficient (R) of -0.562 and weighted average of 14.5%. Similarly, the statistical analysis conducted on geographies consisting of 132,580,615 people shows a weak negative correlation between the proportion of Macedonians and percentage of population with at least master's degree education in the United States with a correlation coefficient (R) of -0.209 and weighted average of 16.7%, a difference of 15.4%.
Master's Degree Correlation Summary
| Measurement | Belgian | Macedonian |
| Minimum | 1.6% | 1.8% |
| Maximum | 16.5% | 31.0% |
| Range | 14.9% | 29.2% |
| Mean | 8.6% | 15.1% |
| Median | 8.8% | 15.8% |
| Interquartile 25% (IQ1) | 5.3% | 11.8% |
| Interquartile 75% (IQ3) | 10.7% | 18.4% |
| Interquartile Range (IQR) | 5.5% | 6.6% |
| Standard Deviation (Sample) | 3.8% | 6.0% |
| Standard Deviation (Population) | 3.7% | 5.9% |
Similar Demographics by Master's Degree
Demographics Similar to Belgians by Master's Degree
In terms of master's degree, the demographic groups most similar to Belgians are West Indian (14.5%, a difference of 0.10%), Immigrants from Armenia (14.5%, a difference of 0.14%), Czechoslovakian (14.5%, a difference of 0.31%), Panamanian (14.4%, a difference of 0.50%), and Scotch-Irish (14.4%, a difference of 0.51%).
| Demographics | Rating | Rank | Master's Degree |
| Spaniards | 35.8 /100 | #190 | Fair 14.6% |
| Welsh | 34.2 /100 | #191 | Fair 14.6% |
| Immigrants | Middle Africa | 33.6 /100 | #192 | Fair 14.6% |
| Immigrants | Nigeria | 32.7 /100 | #193 | Fair 14.6% |
| Chinese | 32.5 /100 | #194 | Fair 14.6% |
| Danes | 31.3 /100 | #195 | Fair 14.5% |
| Czechoslovakians | 29.9 /100 | #196 | Fair 14.5% |
| Belgians | 28.0 /100 | #197 | Fair 14.5% |
| West Indians | 27.4 /100 | #198 | Fair 14.5% |
| Immigrants | Armenia | 27.2 /100 | #199 | Fair 14.5% |
| Panamanians | 25.1 /100 | #200 | Fair 14.4% |
| Scotch-Irish | 25.0 /100 | #201 | Fair 14.4% |
| Immigrants | Western Africa | 24.9 /100 | #202 | Fair 14.4% |
| Yugoslavians | 24.3 /100 | #203 | Fair 14.4% |
| French | 23.7 /100 | #204 | Fair 14.4% |
Demographics Similar to Macedonians by Master's Degree
In terms of master's degree, the demographic groups most similar to Macedonians are Arab (16.7%, a difference of 0.010%), Northern European (16.7%, a difference of 0.080%), Austrian (16.7%, a difference of 0.14%), Immigrants from Uganda (16.6%, a difference of 0.38%), and Immigrants from Chile (16.8%, a difference of 0.41%).
| Demographics | Rating | Rank | Master's Degree |
| Syrians | 98.3 /100 | #105 | Exceptional 16.8% |
| Immigrants | Albania | 98.1 /100 | #106 | Exceptional 16.8% |
| Armenians | 98.0 /100 | #107 | Exceptional 16.8% |
| Sierra Leoneans | 98.0 /100 | #108 | Exceptional 16.8% |
| Moroccans | 98.0 /100 | #109 | Exceptional 16.8% |
| Immigrants | Chile | 98.0 /100 | #110 | Exceptional 16.8% |
| Austrians | 97.8 /100 | #111 | Exceptional 16.7% |
| Macedonians | 97.7 /100 | #112 | Exceptional 16.7% |
| Arabs | 97.7 /100 | #113 | Exceptional 16.7% |
| Northern Europeans | 97.6 /100 | #114 | Exceptional 16.7% |
| Immigrants | Uganda | 97.3 /100 | #115 | Exceptional 16.6% |
| Immigrants | Southern Europe | 97.2 /100 | #116 | Exceptional 16.6% |
| Immigrants | Moldova | 97.2 /100 | #117 | Exceptional 16.6% |
| Brazilians | 96.8 /100 | #118 | Exceptional 16.5% |
| Jordanians | 96.5 /100 | #119 | Exceptional 16.5% |