Belgian vs Macedonian Professional Degree
COMPARE
Belgian
Macedonian
Professional Degree
Professional Degree Comparison
Belgians
Macedonians
4.3%
PROFESSIONAL DEGREE
36.2/ 100
METRIC RATING
184th/ 347
METRIC RANK
4.8%
PROFESSIONAL DEGREE
89.8/ 100
METRIC RATING
135th/ 347
METRIC RANK
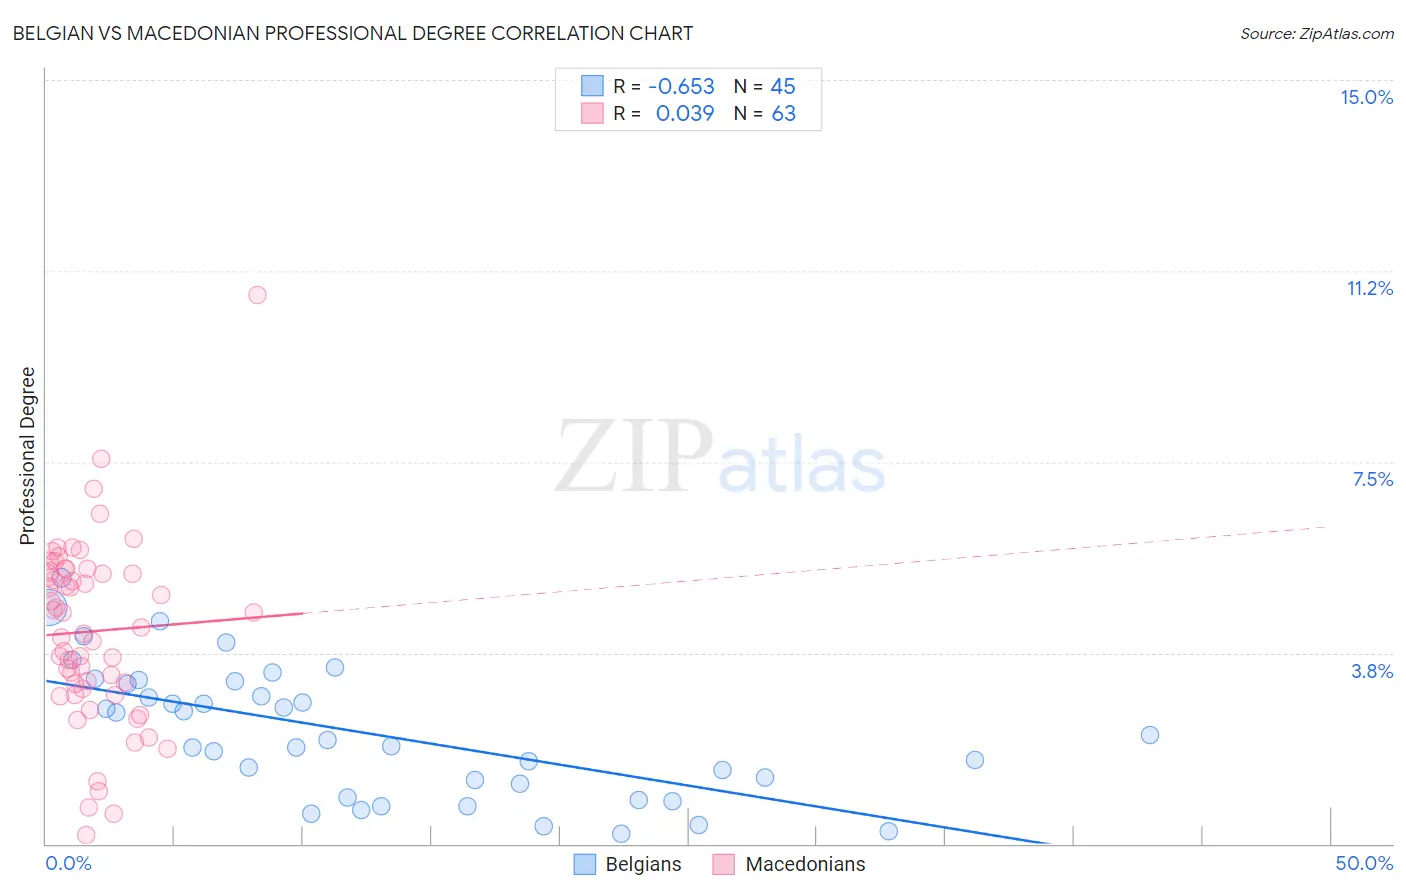
Belgian vs Macedonian Professional Degree Correlation Chart
The statistical analysis conducted on geographies consisting of 355,034,789 people shows a significant negative correlation between the proportion of Belgians and percentage of population with at least professional degree education in the United States with a correlation coefficient (R) of -0.653 and weighted average of 4.3%. Similarly, the statistical analysis conducted on geographies consisting of 132,425,938 people shows no correlation between the proportion of Macedonians and percentage of population with at least professional degree education in the United States with a correlation coefficient (R) of 0.039 and weighted average of 4.8%, a difference of 10.2%.
Professional Degree Correlation Summary
| Measurement | Belgian | Macedonian |
| Minimum | 0.19% | 0.16% |
| Maximum | 5.2% | 10.8% |
| Range | 5.0% | 10.6% |
| Mean | 2.2% | 4.2% |
| Median | 2.0% | 4.2% |
| Interquartile 25% (IQ1) | 1.0% | 3.0% |
| Interquartile 75% (IQ3) | 3.2% | 5.3% |
| Interquartile Range (IQR) | 2.1% | 2.3% |
| Standard Deviation (Sample) | 1.3% | 1.8% |
| Standard Deviation (Population) | 1.3% | 1.8% |
Similar Demographics by Professional Degree
Demographics Similar to Belgians by Professional Degree
In terms of professional degree, the demographic groups most similar to Belgians are Welsh (4.3%, a difference of 0.060%), Scotch-Irish (4.3%, a difference of 0.32%), Immigrants from Cameroon (4.3%, a difference of 0.47%), Immigrants from Thailand (4.3%, a difference of 0.75%), and Slovak (4.3%, a difference of 0.92%).
| Demographics | Rating | Rank | Professional Degree |
| Celtics | 47.6 /100 | #177 | Average 4.4% |
| Immigrants | Costa Rica | 46.7 /100 | #178 | Average 4.4% |
| Immigrants | Kenya | 45.9 /100 | #179 | Average 4.4% |
| Czechs | 44.9 /100 | #180 | Average 4.4% |
| Danes | 43.5 /100 | #181 | Average 4.4% |
| Immigrants | Immigrants | 43.2 /100 | #182 | Average 4.4% |
| Bermudans | 43.1 /100 | #183 | Average 4.4% |
| Belgians | 36.2 /100 | #184 | Fair 4.3% |
| Welsh | 35.8 /100 | #185 | Fair 4.3% |
| Scotch-Irish | 34.2 /100 | #186 | Fair 4.3% |
| Immigrants | Cameroon | 33.3 /100 | #187 | Fair 4.3% |
| Immigrants | Thailand | 31.7 /100 | #188 | Fair 4.3% |
| Slovaks | 30.7 /100 | #189 | Fair 4.3% |
| Immigrants | Poland | 29.2 /100 | #190 | Fair 4.3% |
| Sri Lankans | 29.0 /100 | #191 | Fair 4.3% |
Demographics Similar to Macedonians by Professional Degree
In terms of professional degree, the demographic groups most similar to Macedonians are South American Indian (4.8%, a difference of 0.040%), Italian (4.8%, a difference of 0.16%), Immigrants from Jordan (4.7%, a difference of 0.28%), Jordanian (4.7%, a difference of 0.30%), and Afghan (4.7%, a difference of 0.34%).
| Demographics | Rating | Rank | Professional Degree |
| Immigrants | Eastern Africa | 92.5 /100 | #128 | Exceptional 4.8% |
| Palestinians | 91.5 /100 | #129 | Exceptional 4.8% |
| Icelanders | 91.5 /100 | #130 | Exceptional 4.8% |
| Immigrants | Nepal | 91.4 /100 | #131 | Exceptional 4.8% |
| Pakistanis | 90.9 /100 | #132 | Exceptional 4.8% |
| Italians | 90.2 /100 | #133 | Exceptional 4.8% |
| South American Indians | 89.9 /100 | #134 | Excellent 4.8% |
| Macedonians | 89.8 /100 | #135 | Excellent 4.8% |
| Immigrants | Jordan | 89.0 /100 | #136 | Excellent 4.7% |
| Jordanians | 88.9 /100 | #137 | Excellent 4.7% |
| Afghans | 88.8 /100 | #138 | Excellent 4.7% |
| South Americans | 85.6 /100 | #139 | Excellent 4.7% |
| Canadians | 84.4 /100 | #140 | Excellent 4.7% |
| Basques | 81.8 /100 | #141 | Excellent 4.6% |
| Sudanese | 81.3 /100 | #142 | Excellent 4.6% |