Immigrants from Dominica vs Macedonian 1 or more Vehicles in Household
COMPARE
Immigrants from Dominica
Macedonian
1 or more Vehicles in Household
1 or more Vehicles in Household Comparison
Immigrants from Dominica
Macedonians
77.8%
1 OR MORE VEHICLES IN HOUSEHOLD
0.0/ 100
METRIC RATING
329th/ 347
METRIC RANK
87.9%
1 OR MORE VEHICLES IN HOUSEHOLD
0.6/ 100
METRIC RATING
260th/ 347
METRIC RANK
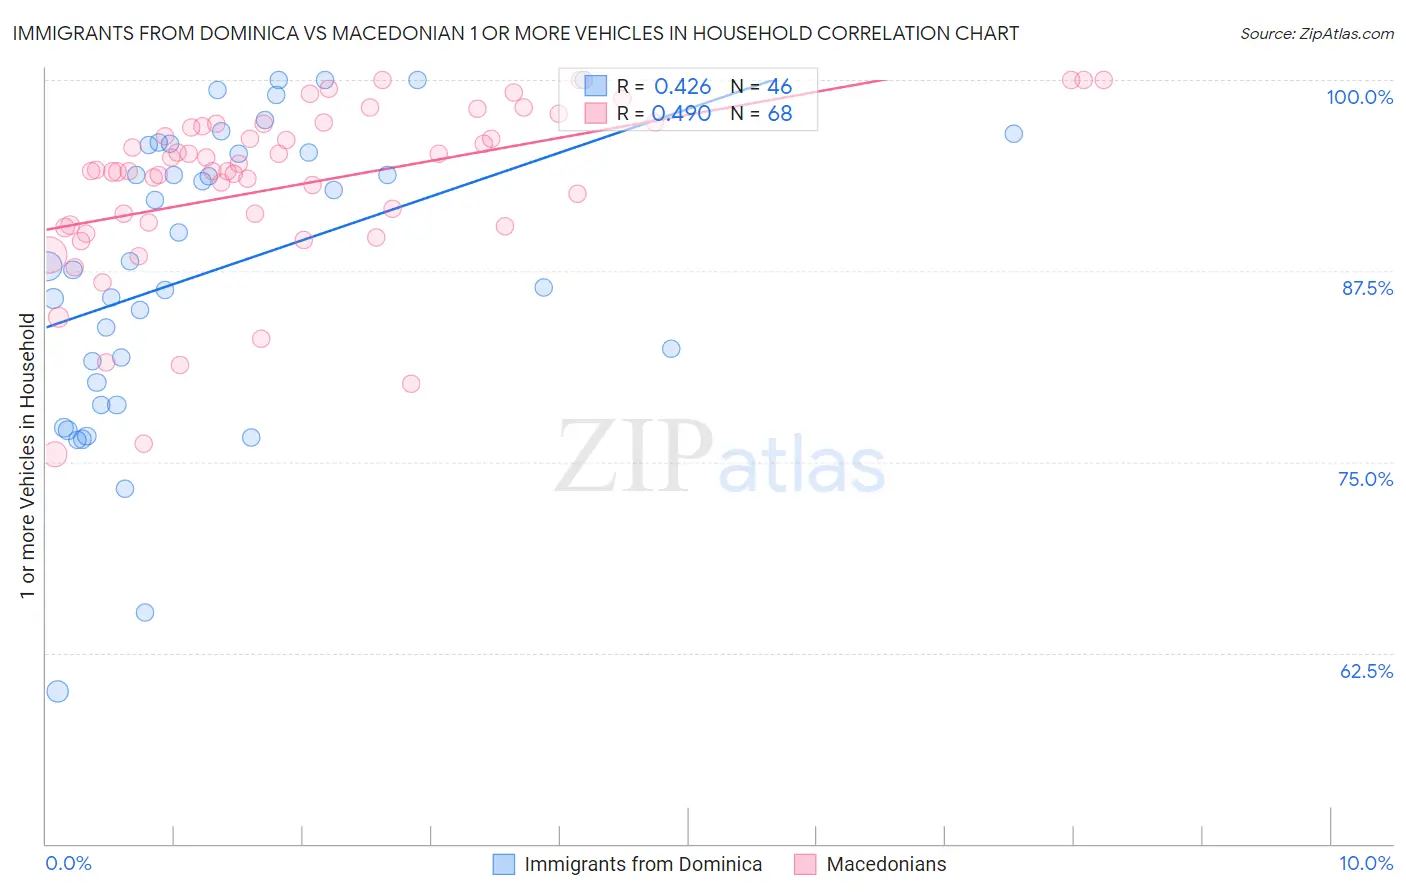
Immigrants from Dominica vs Macedonian 1 or more Vehicles in Household Correlation Chart
The statistical analysis conducted on geographies consisting of 83,789,752 people shows a moderate positive correlation between the proportion of Immigrants from Dominica and percentage of households with 1 or more vehicles available in the United States with a correlation coefficient (R) of 0.426 and weighted average of 77.8%. Similarly, the statistical analysis conducted on geographies consisting of 132,543,746 people shows a moderate positive correlation between the proportion of Macedonians and percentage of households with 1 or more vehicles available in the United States with a correlation coefficient (R) of 0.490 and weighted average of 87.9%, a difference of 13.0%.
1 or more Vehicles in Household Correlation Summary
| Measurement | Immigrants from Dominica | Macedonian |
| Minimum | 60.0% | 75.5% |
| Maximum | 100.0% | 100.0% |
| Range | 40.0% | 24.5% |
| Mean | 87.6% | 93.1% |
| Median | 88.0% | 94.0% |
| Interquartile 25% (IQ1) | 80.2% | 90.5% |
| Interquartile 75% (IQ3) | 95.7% | 97.0% |
| Interquartile Range (IQR) | 15.5% | 6.6% |
| Standard Deviation (Sample) | 9.7% | 5.6% |
| Standard Deviation (Population) | 9.6% | 5.5% |
Similar Demographics by 1 or more Vehicles in Household
Demographics Similar to Immigrants from Dominica by 1 or more Vehicles in Household
In terms of 1 or more vehicles in household, the demographic groups most similar to Immigrants from Dominica are Ecuadorian (77.9%, a difference of 0.14%), Immigrants from Trinidad and Tobago (76.8%, a difference of 1.4%), Immigrants from Senegal (79.0%, a difference of 1.5%), West Indian (76.4%, a difference of 1.9%), and Trinidadian and Tobagonian (76.3%, a difference of 2.0%).
| Demographics | Rating | Rank | 1 or more Vehicles in Household |
| Immigrants | Cabo Verde | 0.0 /100 | #322 | Tragic 81.6% |
| Immigrants | Yemen | 0.0 /100 | #323 | Tragic 80.5% |
| Immigrants | Caribbean | 0.0 /100 | #324 | Tragic 80.4% |
| Senegalese | 0.0 /100 | #325 | Tragic 80.4% |
| Immigrants | West Indies | 0.0 /100 | #326 | Tragic 79.5% |
| Immigrants | Senegal | 0.0 /100 | #327 | Tragic 79.0% |
| Ecuadorians | 0.0 /100 | #328 | Tragic 77.9% |
| Immigrants | Dominica | 0.0 /100 | #329 | Tragic 77.8% |
| Immigrants | Trinidad and Tobago | 0.0 /100 | #330 | Tragic 76.8% |
| West Indians | 0.0 /100 | #331 | Tragic 76.4% |
| Trinidadians and Tobagonians | 0.0 /100 | #332 | Tragic 76.3% |
| Immigrants | Ecuador | 0.0 /100 | #333 | Tragic 76.2% |
| Immigrants | Bangladesh | 0.0 /100 | #334 | Tragic 74.3% |
| Barbadians | 0.0 /100 | #335 | Tragic 74.0% |
| Vietnamese | 0.0 /100 | #336 | Tragic 73.8% |
Demographics Similar to Macedonians by 1 or more Vehicles in Household
In terms of 1 or more vehicles in household, the demographic groups most similar to Macedonians are Immigrants from Switzerland (87.9%, a difference of 0.040%), Subsaharan African (87.9%, a difference of 0.070%), Nigerian (88.0%, a difference of 0.090%), Colombian (88.0%, a difference of 0.12%), and Liberian (88.0%, a difference of 0.12%).
| Demographics | Rating | Rank | 1 or more Vehicles in Household |
| Hondurans | 1.0 /100 | #253 | Tragic 88.1% |
| Haitians | 0.9 /100 | #254 | Tragic 88.1% |
| Immigrants | Latvia | 0.9 /100 | #255 | Tragic 88.1% |
| Colombians | 0.9 /100 | #256 | Tragic 88.0% |
| Liberians | 0.9 /100 | #257 | Tragic 88.0% |
| South American Indians | 0.9 /100 | #258 | Tragic 88.0% |
| Nigerians | 0.8 /100 | #259 | Tragic 88.0% |
| Macedonians | 0.6 /100 | #260 | Tragic 87.9% |
| Immigrants | Switzerland | 0.6 /100 | #261 | Tragic 87.9% |
| Sub-Saharan Africans | 0.5 /100 | #262 | Tragic 87.9% |
| Immigrants | Egypt | 0.5 /100 | #263 | Tragic 87.8% |
| Immigrants | Liberia | 0.4 /100 | #264 | Tragic 87.8% |
| Africans | 0.4 /100 | #265 | Tragic 87.8% |
| Israelis | 0.3 /100 | #266 | Tragic 87.7% |
| Immigrants | Colombia | 0.3 /100 | #267 | Tragic 87.6% |