Australian vs South American 2 or more Vehicles in Household
COMPARE
Australian
South American
2 or more Vehicles in Household
2 or more Vehicles in Household Comparison
Australians
South Americans
56.7%
2 OR MORE VEHICLES IN HOUSEHOLD
91.8/ 100
METRIC RATING
123rd/ 347
METRIC RANK
51.9%
2 OR MORE VEHICLES IN HOUSEHOLD
0.2/ 100
METRIC RATING
271st/ 347
METRIC RANK
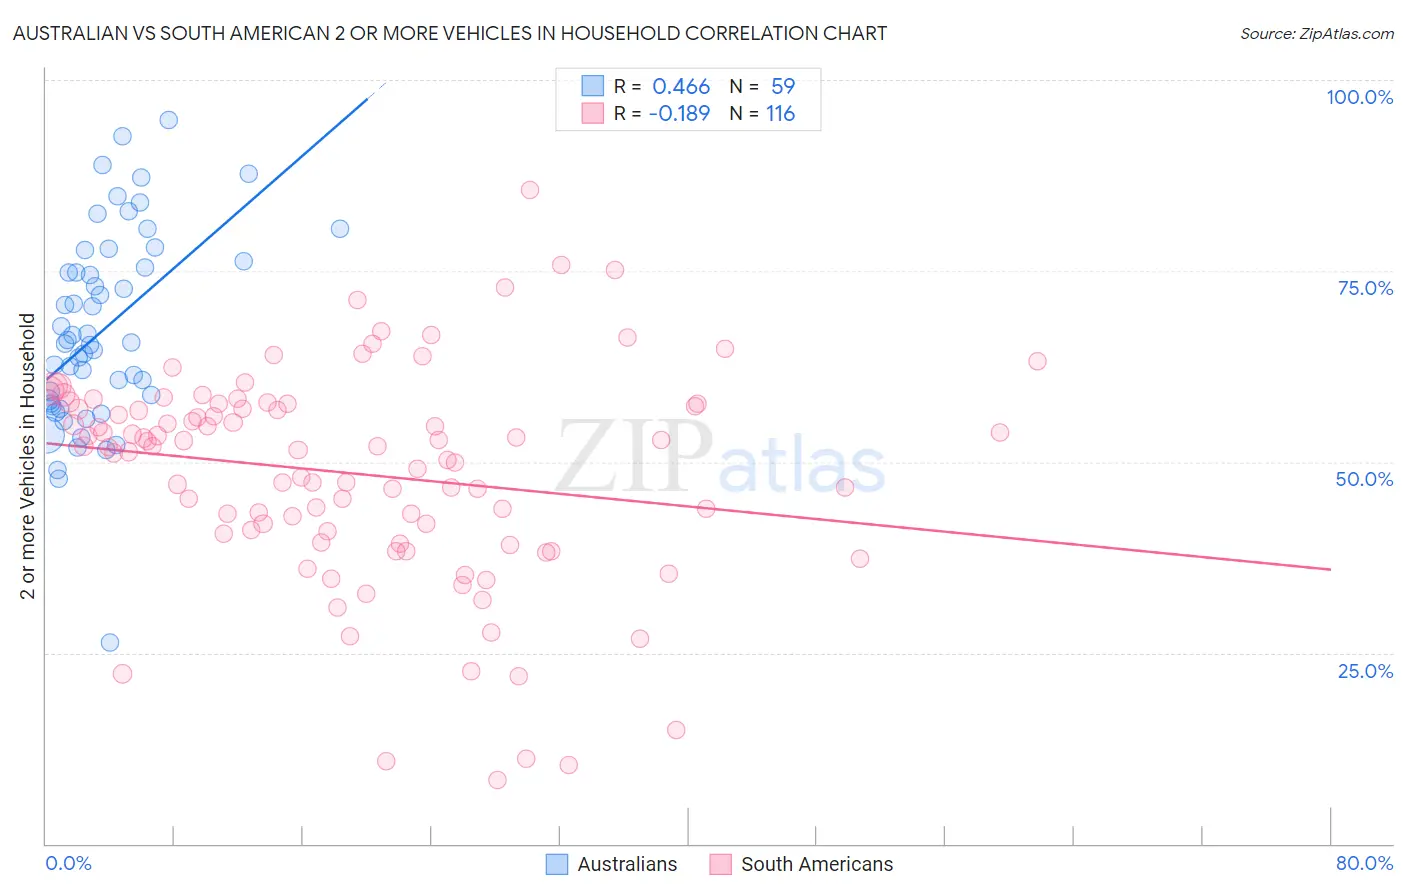
Australian vs South American 2 or more Vehicles in Household Correlation Chart
The statistical analysis conducted on geographies consisting of 223,999,190 people shows a moderate positive correlation between the proportion of Australians and percentage of households with 2 or more vehicles available in the United States with a correlation coefficient (R) of 0.466 and weighted average of 56.7%. Similarly, the statistical analysis conducted on geographies consisting of 493,722,919 people shows a poor negative correlation between the proportion of South Americans and percentage of households with 2 or more vehicles available in the United States with a correlation coefficient (R) of -0.189 and weighted average of 51.9%, a difference of 9.2%.
2 or more Vehicles in Household Correlation Summary
| Measurement | Australian | South American |
| Minimum | 26.3% | 8.3% |
| Maximum | 94.7% | 85.6% |
| Range | 68.4% | 77.2% |
| Mean | 67.3% | 48.5% |
| Median | 65.7% | 52.0% |
| Interquartile 25% (IQ1) | 57.6% | 40.8% |
| Interquartile 75% (IQ3) | 76.3% | 57.4% |
| Interquartile Range (IQR) | 18.7% | 16.7% |
| Standard Deviation (Sample) | 12.9% | 14.1% |
| Standard Deviation (Population) | 12.8% | 14.0% |
Similar Demographics by 2 or more Vehicles in Household
Demographics Similar to Australians by 2 or more Vehicles in Household
In terms of 2 or more vehicles in household, the demographic groups most similar to Australians are New Zealander (56.7%, a difference of 0.0%), Tsimshian (56.7%, a difference of 0.030%), Immigrants from South Africa (56.7%, a difference of 0.090%), Estonian (56.6%, a difference of 0.11%), and Immigrants from Thailand (56.6%, a difference of 0.14%).
| Demographics | Rating | Rank | 2 or more Vehicles in Household |
| Immigrants | Jordan | 96.6 /100 | #116 | Exceptional 57.2% |
| Iraqis | 95.8 /100 | #117 | Exceptional 57.1% |
| Asians | 95.1 /100 | #118 | Exceptional 57.0% |
| Natives/Alaskans | 95.0 /100 | #119 | Exceptional 57.0% |
| Costa Ricans | 94.7 /100 | #120 | Exceptional 56.9% |
| Sioux | 93.8 /100 | #121 | Exceptional 56.8% |
| Immigrants | South Africa | 92.5 /100 | #122 | Exceptional 56.7% |
| Australians | 91.8 /100 | #123 | Exceptional 56.7% |
| New Zealanders | 91.8 /100 | #124 | Exceptional 56.7% |
| Tsimshian | 91.6 /100 | #125 | Exceptional 56.7% |
| Estonians | 90.9 /100 | #126 | Exceptional 56.6% |
| Immigrants | Thailand | 90.7 /100 | #127 | Exceptional 56.6% |
| Immigrants | South Central Asia | 90.5 /100 | #128 | Exceptional 56.6% |
| Ute | 90.4 /100 | #129 | Exceptional 56.6% |
| Yugoslavians | 90.0 /100 | #130 | Exceptional 56.6% |
Demographics Similar to South Americans by 2 or more Vehicles in Household
In terms of 2 or more vehicles in household, the demographic groups most similar to South Americans are Subsaharan African (51.9%, a difference of 0.020%), Israeli (51.9%, a difference of 0.12%), African (51.8%, a difference of 0.16%), Immigrants from Ireland (52.0%, a difference of 0.17%), and Immigrants from Honduras (51.8%, a difference of 0.18%).
| Demographics | Rating | Rank | 2 or more Vehicles in Household |
| Immigrants | Latvia | 0.4 /100 | #264 | Tragic 52.2% |
| Immigrants | Congo | 0.3 /100 | #265 | Tragic 52.1% |
| Immigrants | France | 0.2 /100 | #266 | Tragic 52.0% |
| Immigrants | Colombia | 0.2 /100 | #267 | Tragic 52.0% |
| Pima | 0.2 /100 | #268 | Tragic 52.0% |
| Hondurans | 0.2 /100 | #269 | Tragic 52.0% |
| Immigrants | Ireland | 0.2 /100 | #270 | Tragic 52.0% |
| South Americans | 0.2 /100 | #271 | Tragic 51.9% |
| Sub-Saharan Africans | 0.2 /100 | #272 | Tragic 51.9% |
| Israelis | 0.2 /100 | #273 | Tragic 51.9% |
| Africans | 0.2 /100 | #274 | Tragic 51.8% |
| Immigrants | Honduras | 0.2 /100 | #275 | Tragic 51.8% |
| Immigrants | Croatia | 0.2 /100 | #276 | Tragic 51.8% |
| Immigrants | Africa | 0.2 /100 | #277 | Tragic 51.8% |
| Yuman | 0.1 /100 | #278 | Tragic 51.7% |