Australian vs South American Householder Income Under 25 years
COMPARE
Australian
South American
Householder Income Under 25 years
Householder Income Under 25 years Comparison
Australians
South Americans
$53,739
HOUSEHOLDER INCOME UNDER 25 YEARS
97.8/ 100
METRIC RATING
107th/ 347
METRIC RANK
$53,939
HOUSEHOLDER INCOME UNDER 25 YEARS
98.6/ 100
METRIC RATING
101st/ 347
METRIC RANK
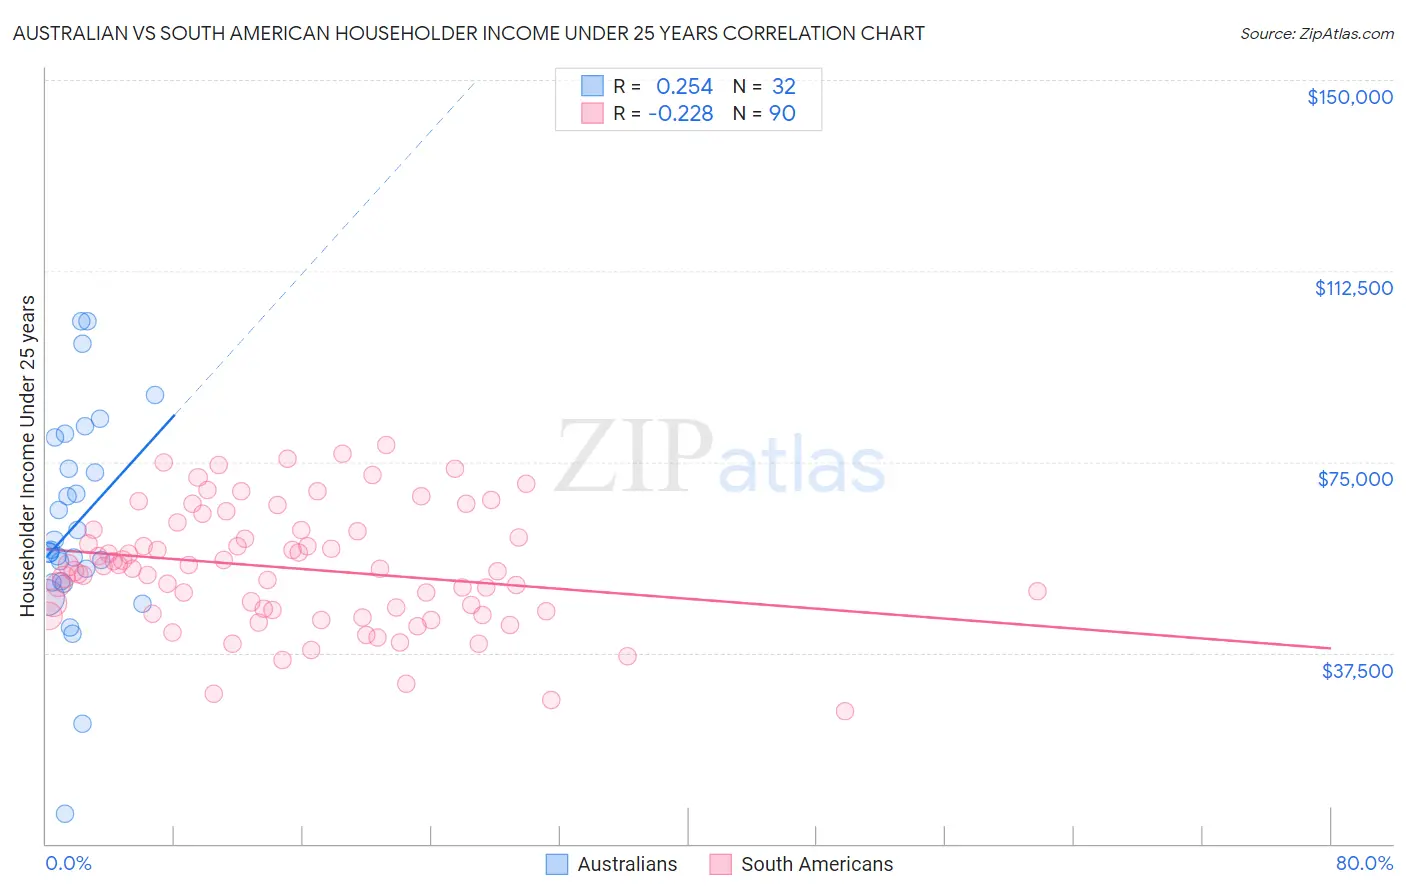
Australian vs South American Householder Income Under 25 years Correlation Chart
The statistical analysis conducted on geographies consisting of 200,158,480 people shows a weak positive correlation between the proportion of Australians and household income with householder under the age of 25 in the United States with a correlation coefficient (R) of 0.254 and weighted average of $53,739. Similarly, the statistical analysis conducted on geographies consisting of 401,700,019 people shows a weak negative correlation between the proportion of South Americans and household income with householder under the age of 25 in the United States with a correlation coefficient (R) of -0.228 and weighted average of $53,939, a difference of 0.37%.
Householder Income Under 25 years Correlation Summary
| Measurement | Australian | South American |
| Minimum | $6,009 | $26,011 |
| Maximum | $102,500 | $78,265 |
| Range | $96,491 | $52,254 |
| Mean | $62,514 | $54,082 |
| Median | $57,436 | $53,957 |
| Interquartile 25% (IQ1) | $51,485 | $45,625 |
| Interquartile 75% (IQ3) | $76,760 | $61,659 |
| Interquartile Range (IQR) | $25,275 | $16,034 |
| Standard Deviation (Sample) | $20,939 | $11,713 |
| Standard Deviation (Population) | $20,609 | $11,648 |
Demographics Similar to Australians and South Americans by Householder Income Under 25 years
In terms of householder income under 25 years, the demographic groups most similar to Australians are Maltese ($53,735, a difference of 0.010%), Immigrants from Ecuador ($53,722, a difference of 0.030%), Greek ($53,715, a difference of 0.040%), Immigrants from Colombia ($53,714, a difference of 0.050%), and Albanian ($53,794, a difference of 0.10%). Similarly, the demographic groups most similar to South Americans are Ecuadorian ($53,911, a difference of 0.050%), Immigrants from Kazakhstan ($53,990, a difference of 0.090%), Alaska Native ($54,000, a difference of 0.11%), Ukrainian ($53,843, a difference of 0.18%), and Ethiopian ($53,818, a difference of 0.22%).
| Demographics | Rating | Rank | Householder Income Under 25 years |
| Immigrants | Sierra Leone | 99.3 /100 | #94 | Exceptional $54,190 |
| Immigrants | Malaysia | 99.2 /100 | #95 | Exceptional $54,179 |
| Argentineans | 99.2 /100 | #96 | Exceptional $54,154 |
| Immigrants | Portugal | 99.1 /100 | #97 | Exceptional $54,105 |
| Eastern Europeans | 99.0 /100 | #98 | Exceptional $54,066 |
| Alaska Natives | 98.8 /100 | #99 | Exceptional $54,000 |
| Immigrants | Kazakhstan | 98.8 /100 | #100 | Exceptional $53,990 |
| South Americans | 98.6 /100 | #101 | Exceptional $53,939 |
| Ecuadorians | 98.5 /100 | #102 | Exceptional $53,911 |
| Ukrainians | 98.3 /100 | #103 | Exceptional $53,843 |
| Ethiopians | 98.2 /100 | #104 | Exceptional $53,818 |
| Immigrants | France | 98.1 /100 | #105 | Exceptional $53,805 |
| Albanians | 98.1 /100 | #106 | Exceptional $53,794 |
| Australians | 97.8 /100 | #107 | Exceptional $53,739 |
| Maltese | 97.8 /100 | #108 | Exceptional $53,735 |
| Immigrants | Ecuador | 97.7 /100 | #109 | Exceptional $53,722 |
| Greeks | 97.7 /100 | #110 | Exceptional $53,715 |
| Immigrants | Colombia | 97.7 /100 | #111 | Exceptional $53,714 |
| Immigrants | Oceania | 97.5 /100 | #112 | Exceptional $53,680 |
| Romanians | 97.2 /100 | #113 | Exceptional $53,632 |
| Immigrants | Sweden | 97.1 /100 | #114 | Exceptional $53,621 |