Cajun vs South American 2 or more Vehicles in Household
COMPARE
Cajun
South American
2 or more Vehicles in Household
2 or more Vehicles in Household Comparison
Cajuns
South Americans
57.7%
2 OR MORE VEHICLES IN HOUSEHOLD
98.5/ 100
METRIC RATING
99th/ 347
METRIC RANK
51.9%
2 OR MORE VEHICLES IN HOUSEHOLD
0.2/ 100
METRIC RATING
271st/ 347
METRIC RANK
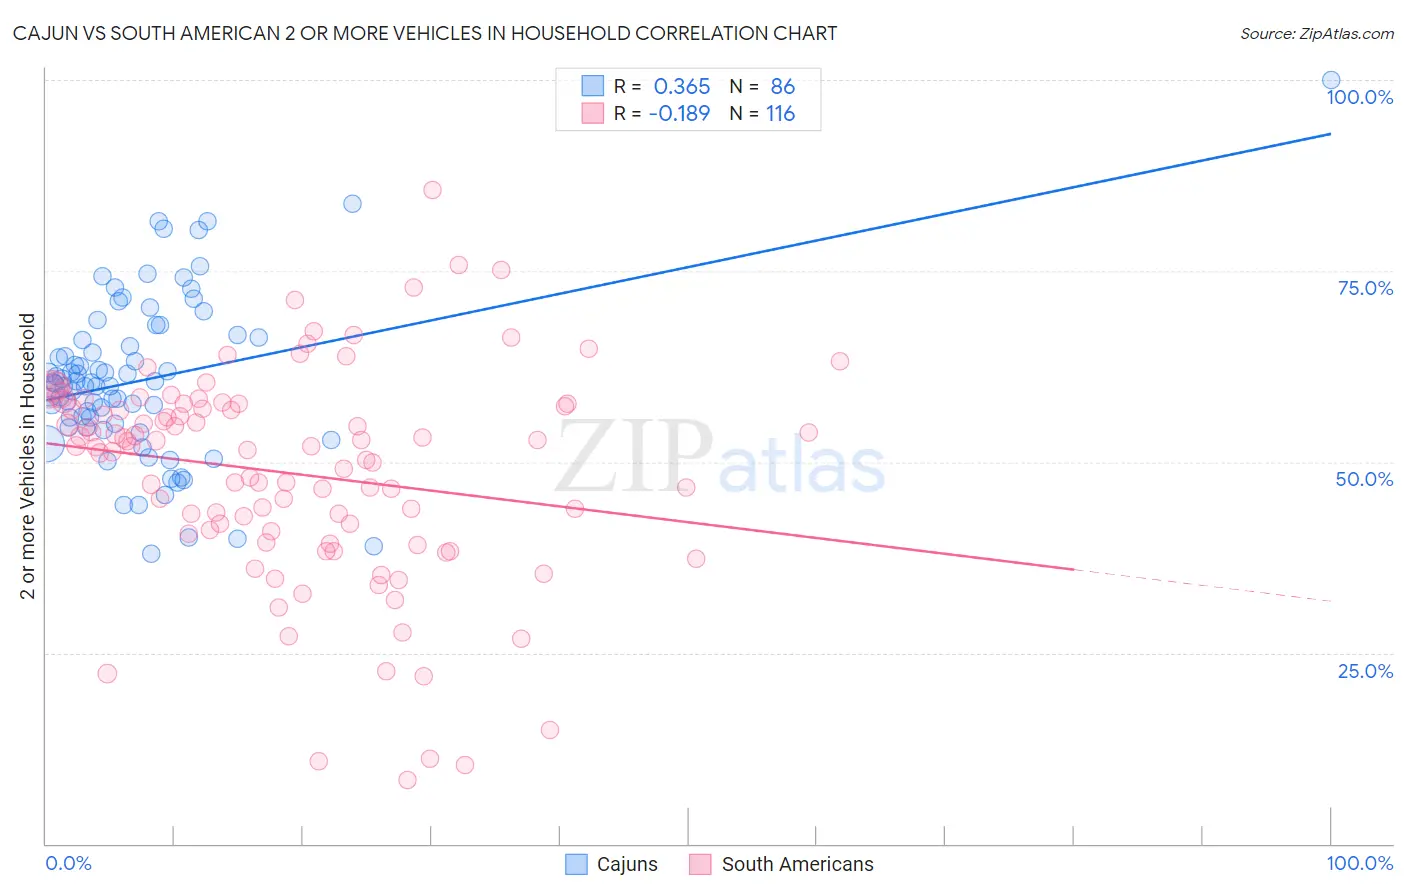
Cajun vs South American 2 or more Vehicles in Household Correlation Chart
The statistical analysis conducted on geographies consisting of 149,695,491 people shows a mild positive correlation between the proportion of Cajuns and percentage of households with 2 or more vehicles available in the United States with a correlation coefficient (R) of 0.365 and weighted average of 57.7%. Similarly, the statistical analysis conducted on geographies consisting of 493,722,919 people shows a poor negative correlation between the proportion of South Americans and percentage of households with 2 or more vehicles available in the United States with a correlation coefficient (R) of -0.189 and weighted average of 51.9%, a difference of 11.1%.
2 or more Vehicles in Household Correlation Summary
| Measurement | Cajun | South American |
| Minimum | 38.0% | 8.3% |
| Maximum | 100.0% | 85.6% |
| Range | 62.0% | 77.2% |
| Mean | 60.8% | 48.5% |
| Median | 60.3% | 52.0% |
| Interquartile 25% (IQ1) | 54.5% | 40.8% |
| Interquartile 75% (IQ3) | 66.2% | 57.4% |
| Interquartile Range (IQR) | 11.7% | 16.7% |
| Standard Deviation (Sample) | 10.8% | 14.1% |
| Standard Deviation (Population) | 10.7% | 14.0% |
Similar Demographics by 2 or more Vehicles in Household
Demographics Similar to Cajuns by 2 or more Vehicles in Household
In terms of 2 or more vehicles in household, the demographic groups most similar to Cajuns are Palestinian (57.7%, a difference of 0.070%), Fijian (57.6%, a difference of 0.070%), Lebanese (57.6%, a difference of 0.12%), Immigrants from Bolivia (57.6%, a difference of 0.16%), and Jordanian (57.6%, a difference of 0.17%).
| Demographics | Rating | Rank | 2 or more Vehicles in Household |
| Shoshone | 99.0 /100 | #92 | Exceptional 57.9% |
| Ottawa | 99.0 /100 | #93 | Exceptional 57.9% |
| Filipinos | 98.9 /100 | #94 | Exceptional 57.8% |
| Hmong | 98.9 /100 | #95 | Exceptional 57.8% |
| Burmese | 98.8 /100 | #96 | Exceptional 57.8% |
| Slavs | 98.8 /100 | #97 | Exceptional 57.8% |
| Palestinians | 98.6 /100 | #98 | Exceptional 57.7% |
| Cajuns | 98.5 /100 | #99 | Exceptional 57.7% |
| Fijians | 98.4 /100 | #100 | Exceptional 57.6% |
| Lebanese | 98.3 /100 | #101 | Exceptional 57.6% |
| Immigrants | Bolivia | 98.2 /100 | #102 | Exceptional 57.6% |
| Jordanians | 98.2 /100 | #103 | Exceptional 57.6% |
| Immigrants | Indonesia | 98.2 /100 | #104 | Exceptional 57.6% |
| Immigrants | Korea | 98.2 /100 | #105 | Exceptional 57.6% |
| Immigrants | Oceania | 98.2 /100 | #106 | Exceptional 57.5% |
Demographics Similar to South Americans by 2 or more Vehicles in Household
In terms of 2 or more vehicles in household, the demographic groups most similar to South Americans are Subsaharan African (51.9%, a difference of 0.020%), Israeli (51.9%, a difference of 0.12%), African (51.8%, a difference of 0.16%), Immigrants from Ireland (52.0%, a difference of 0.17%), and Immigrants from Honduras (51.8%, a difference of 0.18%).
| Demographics | Rating | Rank | 2 or more Vehicles in Household |
| Immigrants | Latvia | 0.4 /100 | #264 | Tragic 52.2% |
| Immigrants | Congo | 0.3 /100 | #265 | Tragic 52.1% |
| Immigrants | France | 0.2 /100 | #266 | Tragic 52.0% |
| Immigrants | Colombia | 0.2 /100 | #267 | Tragic 52.0% |
| Pima | 0.2 /100 | #268 | Tragic 52.0% |
| Hondurans | 0.2 /100 | #269 | Tragic 52.0% |
| Immigrants | Ireland | 0.2 /100 | #270 | Tragic 52.0% |
| South Americans | 0.2 /100 | #271 | Tragic 51.9% |
| Sub-Saharan Africans | 0.2 /100 | #272 | Tragic 51.9% |
| Israelis | 0.2 /100 | #273 | Tragic 51.9% |
| Africans | 0.2 /100 | #274 | Tragic 51.8% |
| Immigrants | Honduras | 0.2 /100 | #275 | Tragic 51.8% |
| Immigrants | Croatia | 0.2 /100 | #276 | Tragic 51.8% |
| Immigrants | Africa | 0.2 /100 | #277 | Tragic 51.8% |
| Yuman | 0.1 /100 | #278 | Tragic 51.7% |