Australian vs Immigrants from Syria 2 or more Vehicles in Household
COMPARE
Australian
Immigrants from Syria
2 or more Vehicles in Household
2 or more Vehicles in Household Comparison
Australians
Immigrants from Syria
56.7%
2 OR MORE VEHICLES IN HOUSEHOLD
91.8/ 100
METRIC RATING
123rd/ 347
METRIC RANK
56.2%
2 OR MORE VEHICLES IN HOUSEHOLD
81.4/ 100
METRIC RATING
144th/ 347
METRIC RANK
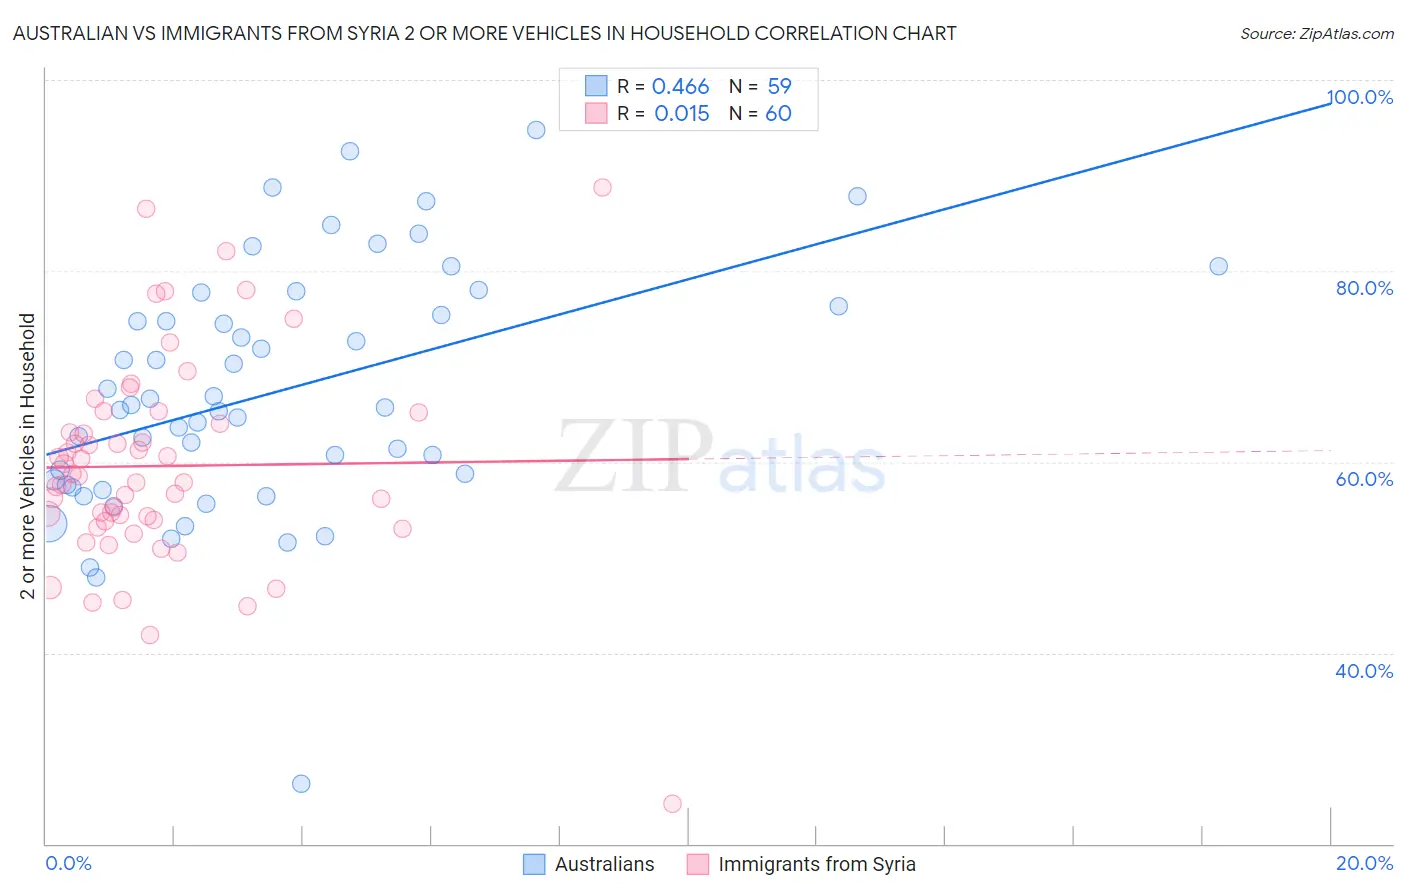
Australian vs Immigrants from Syria 2 or more Vehicles in Household Correlation Chart
The statistical analysis conducted on geographies consisting of 223,999,190 people shows a moderate positive correlation between the proportion of Australians and percentage of households with 2 or more vehicles available in the United States with a correlation coefficient (R) of 0.466 and weighted average of 56.7%. Similarly, the statistical analysis conducted on geographies consisting of 174,033,758 people shows no correlation between the proportion of Immigrants from Syria and percentage of households with 2 or more vehicles available in the United States with a correlation coefficient (R) of 0.015 and weighted average of 56.2%, a difference of 0.92%.
2 or more Vehicles in Household Correlation Summary
| Measurement | Australian | Immigrants from Syria |
| Minimum | 26.3% | 24.2% |
| Maximum | 94.7% | 88.7% |
| Range | 68.4% | 64.5% |
| Mean | 67.3% | 59.6% |
| Median | 65.7% | 58.2% |
| Interquartile 25% (IQ1) | 57.6% | 53.8% |
| Interquartile 75% (IQ3) | 76.3% | 64.6% |
| Interquartile Range (IQR) | 18.7% | 10.8% |
| Standard Deviation (Sample) | 12.9% | 11.0% |
| Standard Deviation (Population) | 12.8% | 10.9% |
Similar Demographics by 2 or more Vehicles in Household
Demographics Similar to Australians by 2 or more Vehicles in Household
In terms of 2 or more vehicles in household, the demographic groups most similar to Australians are New Zealander (56.7%, a difference of 0.0%), Tsimshian (56.7%, a difference of 0.030%), Immigrants from South Africa (56.7%, a difference of 0.090%), Estonian (56.6%, a difference of 0.11%), and Immigrants from Thailand (56.6%, a difference of 0.14%).
| Demographics | Rating | Rank | 2 or more Vehicles in Household |
| Immigrants | Jordan | 96.6 /100 | #116 | Exceptional 57.2% |
| Iraqis | 95.8 /100 | #117 | Exceptional 57.1% |
| Asians | 95.1 /100 | #118 | Exceptional 57.0% |
| Natives/Alaskans | 95.0 /100 | #119 | Exceptional 57.0% |
| Costa Ricans | 94.7 /100 | #120 | Exceptional 56.9% |
| Sioux | 93.8 /100 | #121 | Exceptional 56.8% |
| Immigrants | South Africa | 92.5 /100 | #122 | Exceptional 56.7% |
| Australians | 91.8 /100 | #123 | Exceptional 56.7% |
| New Zealanders | 91.8 /100 | #124 | Exceptional 56.7% |
| Tsimshian | 91.6 /100 | #125 | Exceptional 56.7% |
| Estonians | 90.9 /100 | #126 | Exceptional 56.6% |
| Immigrants | Thailand | 90.7 /100 | #127 | Exceptional 56.6% |
| Immigrants | South Central Asia | 90.5 /100 | #128 | Exceptional 56.6% |
| Ute | 90.4 /100 | #129 | Exceptional 56.6% |
| Yugoslavians | 90.0 /100 | #130 | Exceptional 56.6% |
Demographics Similar to Immigrants from Syria by 2 or more Vehicles in Household
In terms of 2 or more vehicles in household, the demographic groups most similar to Immigrants from Syria are Syrian (56.2%, a difference of 0.010%), Seminole (56.2%, a difference of 0.020%), Venezuelan (56.1%, a difference of 0.050%), Serbian (56.1%, a difference of 0.070%), and Immigrants from Moldova (56.1%, a difference of 0.070%).
| Demographics | Rating | Rank | 2 or more Vehicles in Household |
| Cubans | 84.8 /100 | #137 | Excellent 56.3% |
| Salvadorans | 84.7 /100 | #138 | Excellent 56.3% |
| Armenians | 84.3 /100 | #139 | Excellent 56.3% |
| Latvians | 83.6 /100 | #140 | Excellent 56.2% |
| Immigrants | Cambodia | 83.6 /100 | #141 | Excellent 56.2% |
| South Africans | 83.1 /100 | #142 | Excellent 56.2% |
| Seminole | 81.7 /100 | #143 | Excellent 56.2% |
| Immigrants | Syria | 81.4 /100 | #144 | Excellent 56.2% |
| Syrians | 81.2 /100 | #145 | Excellent 56.2% |
| Venezuelans | 80.7 /100 | #146 | Excellent 56.1% |
| Serbians | 80.3 /100 | #147 | Excellent 56.1% |
| Immigrants | Moldova | 80.2 /100 | #148 | Excellent 56.1% |
| Chileans | 80.2 /100 | #149 | Excellent 56.1% |
| Nicaraguans | 79.9 /100 | #150 | Good 56.1% |
| Immigrants | Northern Europe | 78.7 /100 | #151 | Good 56.1% |