Apache vs Immigrants from Brazil 4 or more Vehicles in Household
COMPARE
Apache
Immigrants from Brazil
4 or more Vehicles in Household
4 or more Vehicles in Household Comparison
Apache
Immigrants from Brazil
7.4%
4 OR MORE VEHICLES IN HOUSEHOLD
99.9/ 100
METRIC RATING
77th/ 347
METRIC RANK
5.2%
4 OR MORE VEHICLES IN HOUSEHOLD
0.1/ 100
METRIC RATING
295th/ 347
METRIC RANK
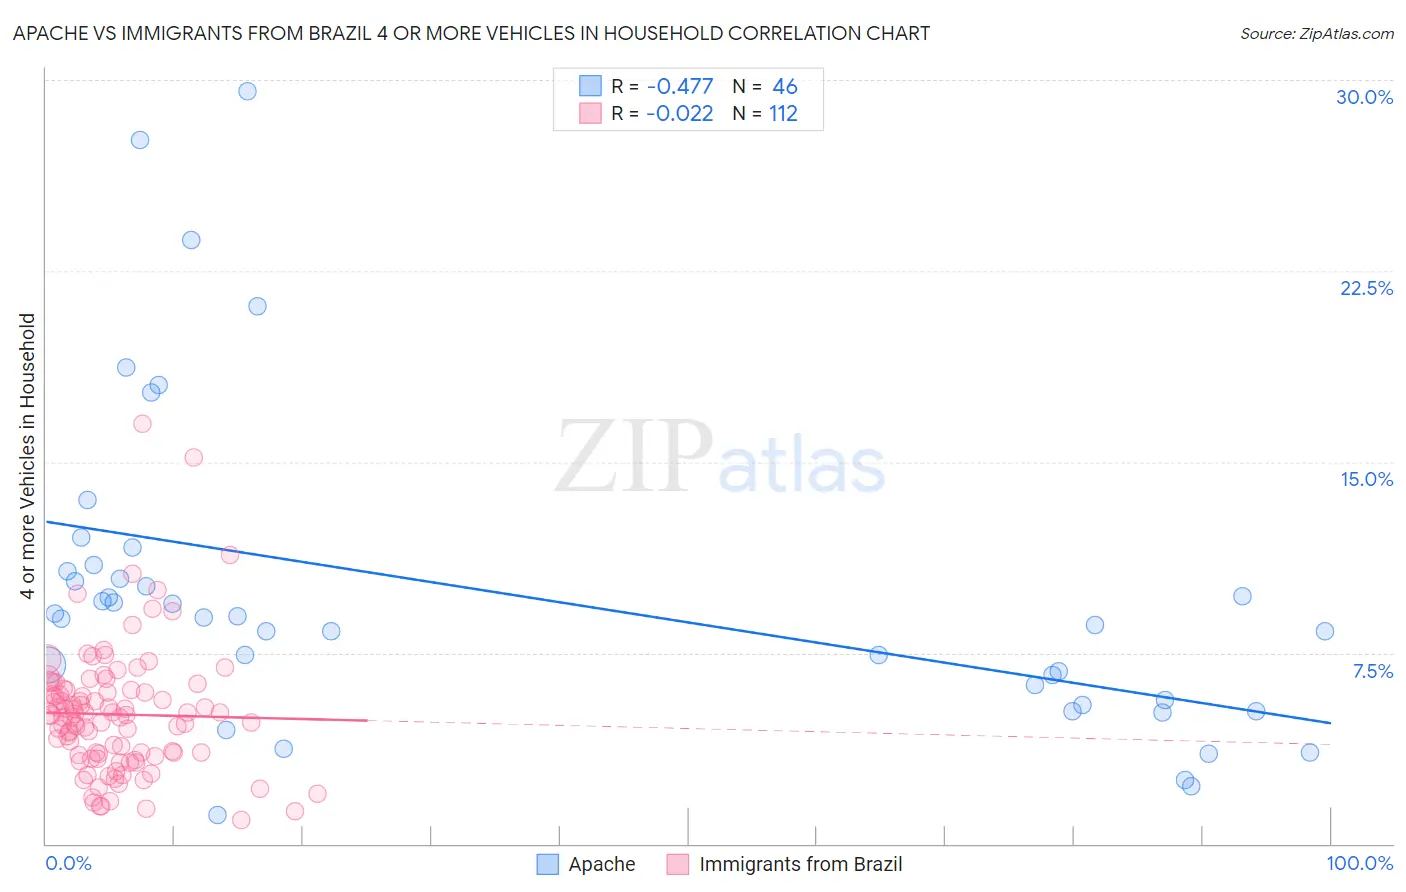
Apache vs Immigrants from Brazil 4 or more Vehicles in Household Correlation Chart
The statistical analysis conducted on geographies consisting of 230,812,683 people shows a moderate negative correlation between the proportion of Apache and percentage of households with 4 or more vehicles available in the United States with a correlation coefficient (R) of -0.477 and weighted average of 7.4%. Similarly, the statistical analysis conducted on geographies consisting of 341,468,936 people shows no correlation between the proportion of Immigrants from Brazil and percentage of households with 4 or more vehicles available in the United States with a correlation coefficient (R) of -0.022 and weighted average of 5.2%, a difference of 40.6%.
4 or more Vehicles in Household Correlation Summary
| Measurement | Apache | Immigrants from Brazil |
| Minimum | 1.1% | 0.95% |
| Maximum | 29.6% | 16.5% |
| Range | 28.5% | 15.6% |
| Mean | 9.8% | 5.1% |
| Median | 8.9% | 5.0% |
| Interquartile 25% (IQ1) | 5.6% | 3.5% |
| Interquartile 75% (IQ3) | 10.7% | 6.0% |
| Interquartile Range (IQR) | 5.1% | 2.6% |
| Standard Deviation (Sample) | 6.2% | 2.5% |
| Standard Deviation (Population) | 6.2% | 2.5% |
Similar Demographics by 4 or more Vehicles in Household
Demographics Similar to Apache by 4 or more Vehicles in Household
In terms of 4 or more vehicles in household, the demographic groups most similar to Apache are White/Caucasian (7.4%, a difference of 0.060%), Laotian (7.4%, a difference of 0.17%), Icelander (7.4%, a difference of 0.22%), Immigrants from Cambodia (7.4%, a difference of 0.22%), and Czech (7.4%, a difference of 0.24%).
| Demographics | Rating | Rank | 4 or more Vehicles in Household |
| Scottish | 99.9 /100 | #70 | Exceptional 7.4% |
| Chickasaw | 99.9 /100 | #71 | Exceptional 7.4% |
| Scotch-Irish | 99.9 /100 | #72 | Exceptional 7.4% |
| Portuguese | 99.9 /100 | #73 | Exceptional 7.4% |
| Icelanders | 99.9 /100 | #74 | Exceptional 7.4% |
| Immigrants | Cambodia | 99.9 /100 | #75 | Exceptional 7.4% |
| Laotians | 99.9 /100 | #76 | Exceptional 7.4% |
| Apache | 99.9 /100 | #77 | Exceptional 7.4% |
| Whites/Caucasians | 99.8 /100 | #78 | Exceptional 7.4% |
| Czechs | 99.8 /100 | #79 | Exceptional 7.4% |
| Alaska Natives | 99.8 /100 | #80 | Exceptional 7.3% |
| Finns | 99.8 /100 | #81 | Exceptional 7.3% |
| Northern Europeans | 99.8 /100 | #82 | Exceptional 7.3% |
| Potawatomi | 99.7 /100 | #83 | Exceptional 7.3% |
| Afghans | 99.7 /100 | #84 | Exceptional 7.3% |
Demographics Similar to Immigrants from Brazil by 4 or more Vehicles in Household
In terms of 4 or more vehicles in household, the demographic groups most similar to Immigrants from Brazil are Ghanaian (5.2%, a difference of 0.11%), Immigrants from Congo (5.2%, a difference of 0.17%), Israeli (5.2%, a difference of 0.18%), Liberian (5.3%, a difference of 0.20%), and Immigrants from Bahamas (5.3%, a difference of 0.30%).
| Demographics | Rating | Rank | 4 or more Vehicles in Household |
| Venezuelans | 0.2 /100 | #288 | Tragic 5.3% |
| Immigrants | Bosnia and Herzegovina | 0.2 /100 | #289 | Tragic 5.3% |
| Immigrants | Russia | 0.2 /100 | #290 | Tragic 5.3% |
| Immigrants | Bahamas | 0.1 /100 | #291 | Tragic 5.3% |
| Liberians | 0.1 /100 | #292 | Tragic 5.3% |
| Immigrants | Congo | 0.1 /100 | #293 | Tragic 5.2% |
| Ghanaians | 0.1 /100 | #294 | Tragic 5.2% |
| Immigrants | Brazil | 0.1 /100 | #295 | Tragic 5.2% |
| Israelis | 0.1 /100 | #296 | Tragic 5.2% |
| Immigrants | Venezuela | 0.1 /100 | #297 | Tragic 5.2% |
| Immigrants | South America | 0.1 /100 | #298 | Tragic 5.2% |
| Immigrants | Ghana | 0.1 /100 | #299 | Tragic 5.2% |
| Immigrants | Morocco | 0.0 /100 | #300 | Tragic 5.1% |
| Immigrants | Zaire | 0.0 /100 | #301 | Tragic 5.1% |
| Bahamians | 0.0 /100 | #302 | Tragic 5.1% |