Alsatian vs Panamanian Female Disability
COMPARE
Alsatian
Panamanian
Female Disability
Female Disability Comparison
Alsatians
Panamanians
12.6%
FEMALE DISABILITY
2.5/ 100
METRIC RATING
244th/ 347
METRIC RANK
12.4%
FEMALE DISABILITY
13.5/ 100
METRIC RATING
214th/ 347
METRIC RANK
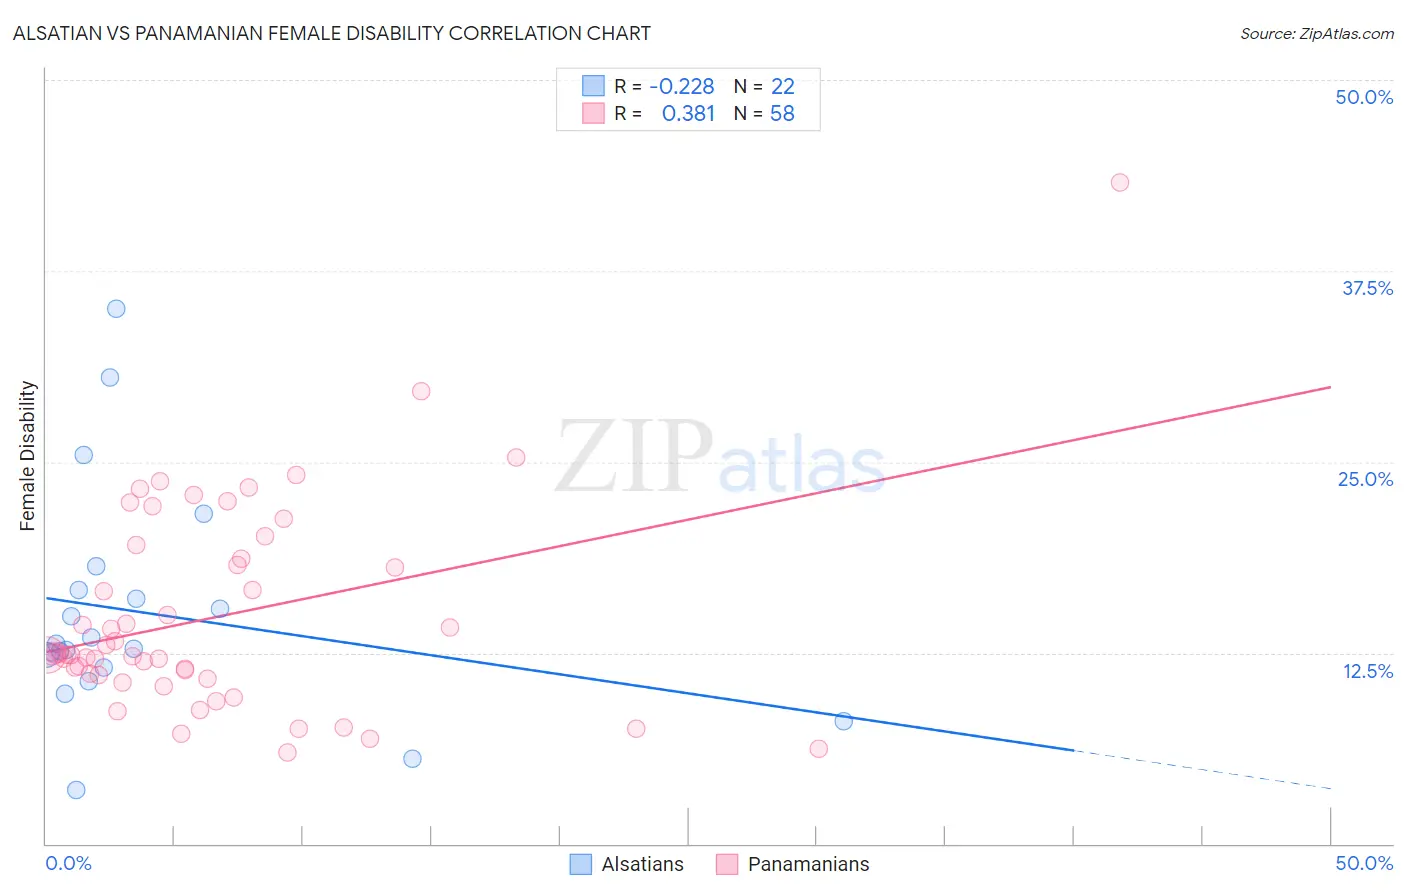
Alsatian vs Panamanian Female Disability Correlation Chart
The statistical analysis conducted on geographies consisting of 82,681,470 people shows a weak negative correlation between the proportion of Alsatians and percentage of females with a disability in the United States with a correlation coefficient (R) of -0.228 and weighted average of 12.6%. Similarly, the statistical analysis conducted on geographies consisting of 281,177,048 people shows a mild positive correlation between the proportion of Panamanians and percentage of females with a disability in the United States with a correlation coefficient (R) of 0.381 and weighted average of 12.4%, a difference of 1.7%.
Female Disability Correlation Summary
| Measurement | Alsatian | Panamanian |
| Minimum | 3.5% | 6.0% |
| Maximum | 35.1% | 43.3% |
| Range | 31.5% | 37.3% |
| Mean | 15.1% | 14.9% |
| Median | 13.0% | 12.4% |
| Interquartile 25% (IQ1) | 11.6% | 11.0% |
| Interquartile 75% (IQ3) | 16.6% | 18.6% |
| Interquartile Range (IQR) | 5.1% | 7.6% |
| Standard Deviation (Sample) | 7.5% | 6.7% |
| Standard Deviation (Population) | 7.3% | 6.7% |
Similar Demographics by Female Disability
Demographics Similar to Alsatians by Female Disability
In terms of female disability, the demographic groups most similar to Alsatians are Immigrants from Senegal (12.6%, a difference of 0.010%), Canadian (12.6%, a difference of 0.020%), Japanese (12.6%, a difference of 0.070%), Immigrants from Jamaica (12.6%, a difference of 0.14%), and Spanish American Indian (12.6%, a difference of 0.15%).
| Demographics | Rating | Rank | Female Disability |
| Slavs | 3.8 /100 | #237 | Tragic 12.6% |
| Yugoslavians | 3.7 /100 | #238 | Tragic 12.6% |
| Barbadians | 3.6 /100 | #239 | Tragic 12.6% |
| German Russians | 3.2 /100 | #240 | Tragic 12.6% |
| Japanese | 2.7 /100 | #241 | Tragic 12.6% |
| Canadians | 2.6 /100 | #242 | Tragic 12.6% |
| Immigrants | Senegal | 2.5 /100 | #243 | Tragic 12.6% |
| Alsatians | 2.5 /100 | #244 | Tragic 12.6% |
| Immigrants | Jamaica | 2.2 /100 | #245 | Tragic 12.6% |
| Spanish American Indians | 2.1 /100 | #246 | Tragic 12.6% |
| Menominee | 2.1 /100 | #247 | Tragic 12.6% |
| Carpatho Rusyns | 2.0 /100 | #248 | Tragic 12.6% |
| Immigrants | Congo | 1.8 /100 | #249 | Tragic 12.7% |
| Slovenes | 1.7 /100 | #250 | Tragic 12.7% |
| Crow | 1.6 /100 | #251 | Tragic 12.7% |
Demographics Similar to Panamanians by Female Disability
In terms of female disability, the demographic groups most similar to Panamanians are Samoan (12.4%, a difference of 0.0%), Immigrants from Burma/Myanmar (12.4%, a difference of 0.010%), British (12.4%, a difference of 0.060%), Immigrants from Thailand (12.4%, a difference of 0.080%), and Immigrants from Bahamas (12.4%, a difference of 0.080%).
| Demographics | Rating | Rank | Female Disability |
| Croatians | 20.2 /100 | #207 | Fair 12.4% |
| Basques | 17.5 /100 | #208 | Poor 12.4% |
| Mexicans | 15.7 /100 | #209 | Poor 12.4% |
| Swiss | 14.9 /100 | #210 | Poor 12.4% |
| Immigrants | Bosnia and Herzegovina | 14.8 /100 | #211 | Poor 12.4% |
| Ute | 14.7 /100 | #212 | Poor 12.4% |
| Immigrants | Thailand | 14.5 /100 | #213 | Poor 12.4% |
| Panamanians | 13.5 /100 | #214 | Poor 12.4% |
| Samoans | 13.4 /100 | #215 | Poor 12.4% |
| Immigrants | Burma/Myanmar | 13.3 /100 | #216 | Poor 12.4% |
| British | 12.7 /100 | #217 | Poor 12.4% |
| Immigrants | Bahamas | 12.5 /100 | #218 | Poor 12.4% |
| Europeans | 12.1 /100 | #219 | Poor 12.4% |
| Bahamians | 11.1 /100 | #220 | Poor 12.4% |
| Native Hawaiians | 10.8 /100 | #221 | Poor 12.4% |