Aleut vs Burmese 2 or more Vehicles in Household
COMPARE
Aleut
Burmese
2 or more Vehicles in Household
2 or more Vehicles in Household Comparison
Aleuts
Burmese
54.1%
2 OR MORE VEHICLES IN HOUSEHOLD
9.3/ 100
METRIC RATING
215th/ 347
METRIC RANK
57.8%
2 OR MORE VEHICLES IN HOUSEHOLD
98.8/ 100
METRIC RATING
96th/ 347
METRIC RANK
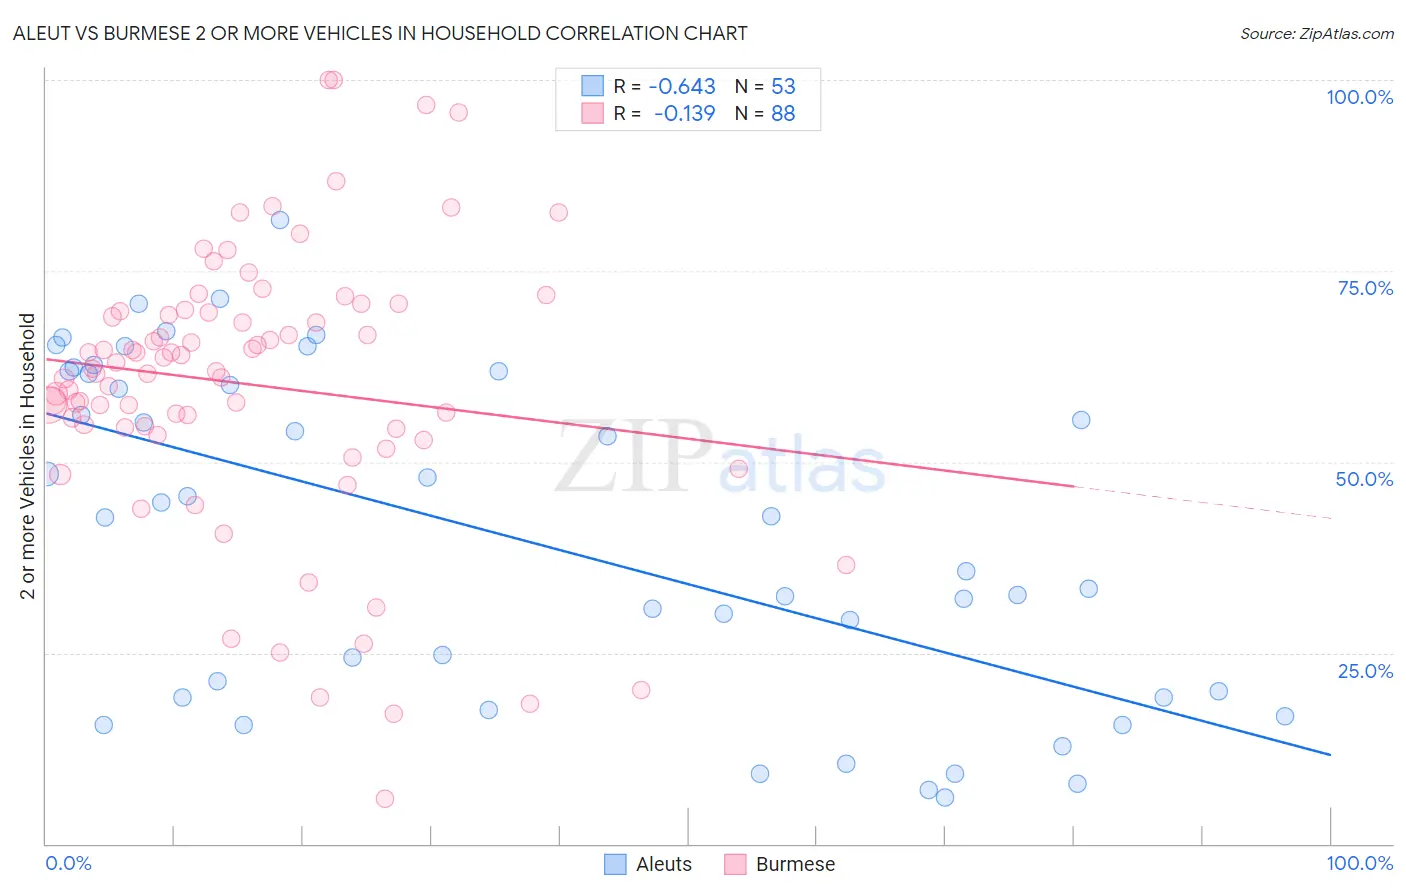
Aleut vs Burmese 2 or more Vehicles in Household Correlation Chart
The statistical analysis conducted on geographies consisting of 61,767,595 people shows a significant negative correlation between the proportion of Aleuts and percentage of households with 2 or more vehicles available in the United States with a correlation coefficient (R) of -0.643 and weighted average of 54.1%. Similarly, the statistical analysis conducted on geographies consisting of 464,950,170 people shows a poor negative correlation between the proportion of Burmese and percentage of households with 2 or more vehicles available in the United States with a correlation coefficient (R) of -0.139 and weighted average of 57.8%, a difference of 6.8%.
2 or more Vehicles in Household Correlation Summary
| Measurement | Aleut | Burmese |
| Minimum | 6.1% | 5.9% |
| Maximum | 81.6% | 100.0% |
| Range | 75.6% | 94.1% |
| Mean | 40.1% | 60.1% |
| Median | 42.7% | 62.0% |
| Interquartile 25% (IQ1) | 19.2% | 54.5% |
| Interquartile 75% (IQ3) | 61.7% | 69.7% |
| Interquartile Range (IQR) | 42.5% | 15.2% |
| Standard Deviation (Sample) | 21.7% | 18.3% |
| Standard Deviation (Population) | 21.5% | 18.2% |
Similar Demographics by 2 or more Vehicles in Household
Demographics Similar to Aleuts by 2 or more Vehicles in Household
In terms of 2 or more vehicles in household, the demographic groups most similar to Aleuts are Immigrants from Western Asia (54.1%, a difference of 0.0%), Immigrants from Czechoslovakia (54.1%, a difference of 0.010%), Guatemalan (54.1%, a difference of 0.030%), Immigrants from Chile (54.2%, a difference of 0.20%), and Immigrants from Hungary (54.2%, a difference of 0.22%).
| Demographics | Rating | Rank | 2 or more Vehicles in Household |
| Egyptians | 12.0 /100 | #208 | Poor 54.3% |
| Immigrants | Bulgaria | 12.0 /100 | #209 | Poor 54.3% |
| Immigrants | Saudi Arabia | 11.3 /100 | #210 | Poor 54.2% |
| Immigrants | Hungary | 11.3 /100 | #211 | Poor 54.2% |
| Immigrants | Chile | 11.1 /100 | #212 | Poor 54.2% |
| Guatemalans | 9.6 /100 | #213 | Tragic 54.1% |
| Immigrants | Czechoslovakia | 9.4 /100 | #214 | Tragic 54.1% |
| Aleuts | 9.3 /100 | #215 | Tragic 54.1% |
| Immigrants | Western Asia | 9.3 /100 | #216 | Tragic 54.1% |
| Immigrants | Burma/Myanmar | 7.1 /100 | #217 | Tragic 53.9% |
| Immigrants | Argentina | 6.8 /100 | #218 | Tragic 53.9% |
| South American Indians | 6.5 /100 | #219 | Tragic 53.9% |
| Taiwanese | 6.3 /100 | #220 | Tragic 53.9% |
| Immigrants | Singapore | 6.3 /100 | #221 | Tragic 53.9% |
| Kiowa | 6.2 /100 | #222 | Tragic 53.9% |
Demographics Similar to Burmese by 2 or more Vehicles in Household
In terms of 2 or more vehicles in household, the demographic groups most similar to Burmese are Slavic (57.8%, a difference of 0.020%), Hmong (57.8%, a difference of 0.030%), Filipino (57.8%, a difference of 0.060%), Shoshone (57.9%, a difference of 0.12%), and Ottawa (57.9%, a difference of 0.12%).
| Demographics | Rating | Rank | 2 or more Vehicles in Household |
| Immigrants | Germany | 99.0 /100 | #89 | Exceptional 57.9% |
| Hispanics or Latinos | 99.0 /100 | #90 | Exceptional 57.9% |
| Pakistanis | 99.0 /100 | #91 | Exceptional 57.9% |
| Shoshone | 99.0 /100 | #92 | Exceptional 57.9% |
| Ottawa | 99.0 /100 | #93 | Exceptional 57.9% |
| Filipinos | 98.9 /100 | #94 | Exceptional 57.8% |
| Hmong | 98.9 /100 | #95 | Exceptional 57.8% |
| Burmese | 98.8 /100 | #96 | Exceptional 57.8% |
| Slavs | 98.8 /100 | #97 | Exceptional 57.8% |
| Palestinians | 98.6 /100 | #98 | Exceptional 57.7% |
| Cajuns | 98.5 /100 | #99 | Exceptional 57.7% |
| Fijians | 98.4 /100 | #100 | Exceptional 57.6% |
| Lebanese | 98.3 /100 | #101 | Exceptional 57.6% |
| Immigrants | Bolivia | 98.2 /100 | #102 | Exceptional 57.6% |
| Jordanians | 98.2 /100 | #103 | Exceptional 57.6% |