Subsaharan African vs Puget Sound Salish Unemployment
COMPARE
Subsaharan African
Puget Sound Salish
Unemployment
Unemployment Comparison
Sub-Saharan Africans
Puget Sound Salish
5.8%
UNEMPLOYMENT
0.1/ 100
METRIC RATING
259th/ 347
METRIC RANK
5.2%
UNEMPLOYMENT
56.6/ 100
METRIC RATING
171st/ 347
METRIC RANK
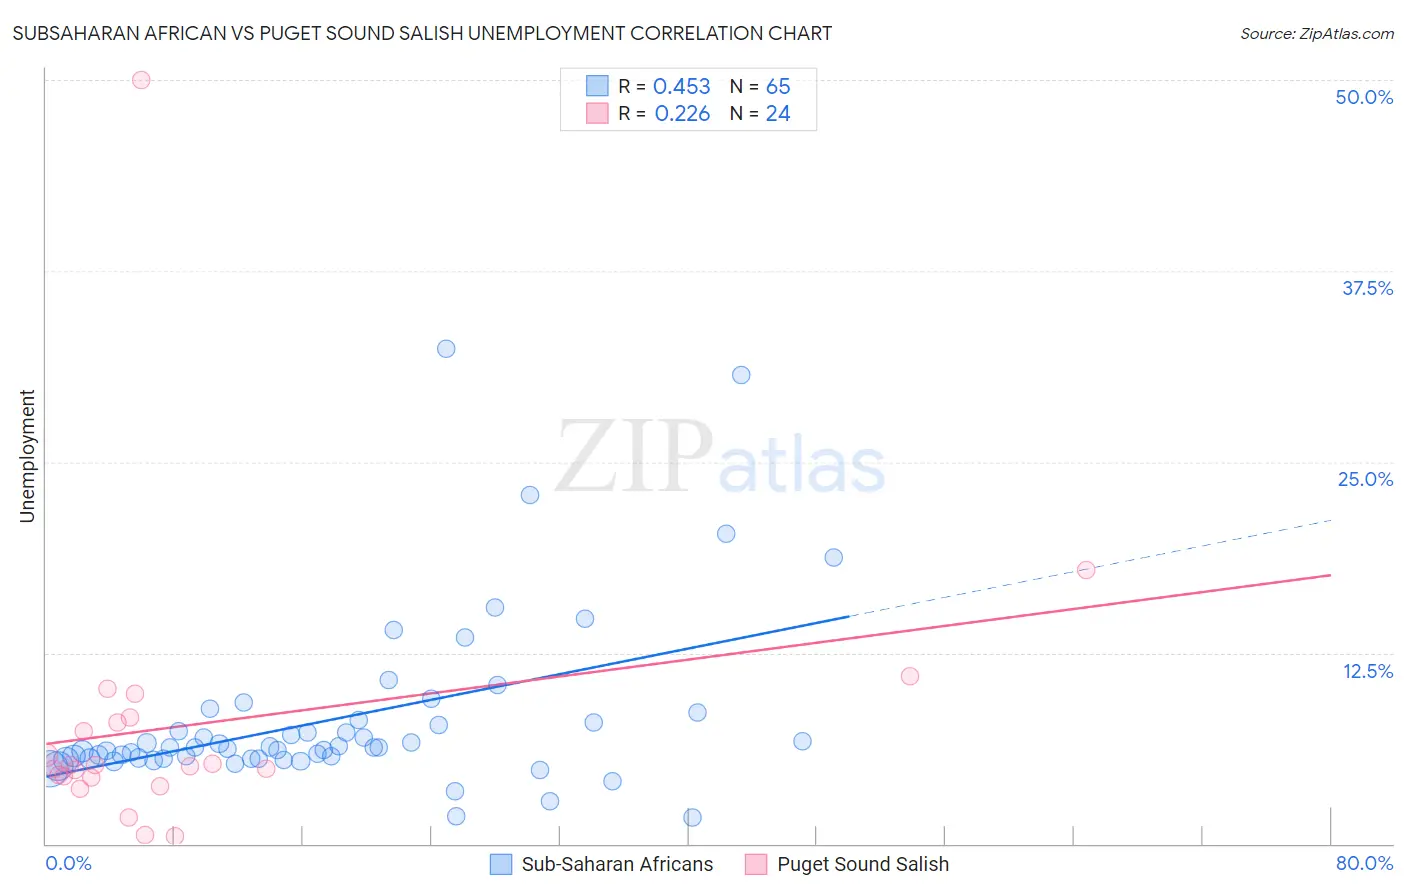
Subsaharan African vs Puget Sound Salish Unemployment Correlation Chart
The statistical analysis conducted on geographies consisting of 507,124,054 people shows a moderate positive correlation between the proportion of Sub-Saharan Africans and unemployment in the United States with a correlation coefficient (R) of 0.453 and weighted average of 5.8%. Similarly, the statistical analysis conducted on geographies consisting of 46,125,873 people shows a weak positive correlation between the proportion of Puget Sound Salish and unemployment in the United States with a correlation coefficient (R) of 0.226 and weighted average of 5.2%, a difference of 10.6%.
Unemployment Correlation Summary
| Measurement | Subsaharan African | Puget Sound Salish |
| Minimum | 1.7% | 0.50% |
| Maximum | 32.4% | 50.0% |
| Range | 30.7% | 49.5% |
| Mean | 8.2% | 7.8% |
| Median | 6.3% | 5.1% |
| Interquartile 25% (IQ1) | 5.6% | 4.4% |
| Interquartile 75% (IQ3) | 8.0% | 8.1% |
| Interquartile Range (IQR) | 2.5% | 3.7% |
| Standard Deviation (Sample) | 5.7% | 9.7% |
| Standard Deviation (Population) | 5.7% | 9.5% |
Similar Demographics by Unemployment
Demographics Similar to Sub-Saharan Africans by Unemployment
In terms of unemployment, the demographic groups most similar to Sub-Saharan Africans are Immigrants from Uzbekistan (5.8%, a difference of 0.020%), Immigrants from Guatemala (5.8%, a difference of 0.040%), Immigrants from Bahamas (5.8%, a difference of 0.12%), Sierra Leonean (5.8%, a difference of 0.14%), and Salvadoran (5.8%, a difference of 0.17%).
| Demographics | Rating | Rank | Unemployment |
| Hondurans | 0.3 /100 | #252 | Tragic 5.7% |
| Central Americans | 0.3 /100 | #253 | Tragic 5.7% |
| Immigrants | Honduras | 0.3 /100 | #254 | Tragic 5.7% |
| Immigrants | Portugal | 0.2 /100 | #255 | Tragic 5.7% |
| Guatemalans | 0.2 /100 | #256 | Tragic 5.8% |
| Yaqui | 0.2 /100 | #257 | Tragic 5.8% |
| Immigrants | Bahamas | 0.1 /100 | #258 | Tragic 5.8% |
| Sub-Saharan Africans | 0.1 /100 | #259 | Tragic 5.8% |
| Immigrants | Uzbekistan | 0.1 /100 | #260 | Tragic 5.8% |
| Immigrants | Guatemala | 0.1 /100 | #261 | Tragic 5.8% |
| Sierra Leoneans | 0.1 /100 | #262 | Tragic 5.8% |
| Salvadorans | 0.1 /100 | #263 | Tragic 5.8% |
| Immigrants | Liberia | 0.1 /100 | #264 | Tragic 5.8% |
| Nigerians | 0.1 /100 | #265 | Tragic 5.8% |
| Mexican American Indians | 0.1 /100 | #266 | Tragic 5.8% |
Demographics Similar to Puget Sound Salish by Unemployment
In terms of unemployment, the demographic groups most similar to Puget Sound Salish are Immigrants from Nicaragua (5.2%, a difference of 0.040%), Immigrants from Morocco (5.2%, a difference of 0.16%), Uruguayan (5.2%, a difference of 0.23%), Immigrants from Vietnam (5.2%, a difference of 0.25%), and Immigrants from Indonesia (5.2%, a difference of 0.29%).
| Demographics | Rating | Rank | Unemployment |
| Immigrants | Colombia | 64.7 /100 | #164 | Good 5.2% |
| Immigrants | Brazil | 63.1 /100 | #165 | Good 5.2% |
| Immigrants | Indonesia | 61.2 /100 | #166 | Good 5.2% |
| Colombians | 61.1 /100 | #167 | Good 5.2% |
| Uruguayans | 60.2 /100 | #168 | Good 5.2% |
| Immigrants | Morocco | 59.1 /100 | #169 | Average 5.2% |
| Immigrants | Nicaragua | 57.1 /100 | #170 | Average 5.2% |
| Puget Sound Salish | 56.6 /100 | #171 | Average 5.2% |
| Immigrants | Vietnam | 52.5 /100 | #172 | Average 5.2% |
| Immigrants | Poland | 51.8 /100 | #173 | Average 5.3% |
| Immigrants | Congo | 50.0 /100 | #174 | Average 5.3% |
| Taiwanese | 49.6 /100 | #175 | Average 5.3% |
| Nicaraguans | 48.7 /100 | #176 | Average 5.3% |
| Immigrants | Nonimmigrants | 47.9 /100 | #177 | Average 5.3% |
| Afghans | 47.4 /100 | #178 | Average 5.3% |