Subsaharan African vs Immigrants from Iran Unemployment
COMPARE
Subsaharan African
Immigrants from Iran
Unemployment
Unemployment Comparison
Sub-Saharan Africans
Immigrants from Iran
5.8%
UNEMPLOYMENT
0.1/ 100
METRIC RATING
259th/ 347
METRIC RANK
5.4%
UNEMPLOYMENT
18.8/ 100
METRIC RATING
209th/ 347
METRIC RANK
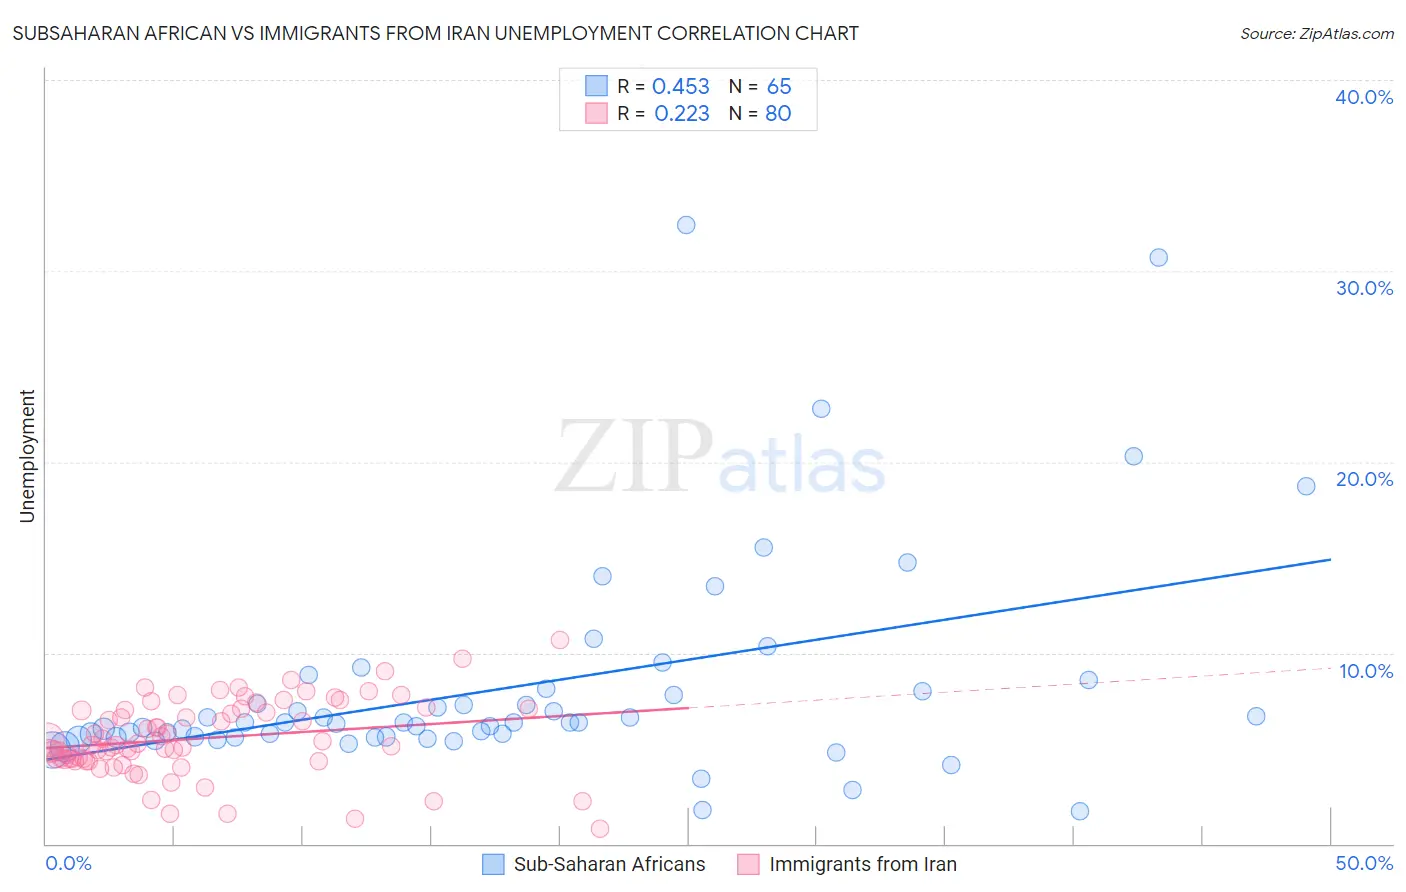
Subsaharan African vs Immigrants from Iran Unemployment Correlation Chart
The statistical analysis conducted on geographies consisting of 507,124,054 people shows a moderate positive correlation between the proportion of Sub-Saharan Africans and unemployment in the United States with a correlation coefficient (R) of 0.453 and weighted average of 5.8%. Similarly, the statistical analysis conducted on geographies consisting of 279,810,569 people shows a weak positive correlation between the proportion of Immigrants from Iran and unemployment in the United States with a correlation coefficient (R) of 0.223 and weighted average of 5.4%, a difference of 7.7%.
Unemployment Correlation Summary
| Measurement | Subsaharan African | Immigrants from Iran |
| Minimum | 1.7% | 0.80% |
| Maximum | 32.4% | 10.7% |
| Range | 30.7% | 9.9% |
| Mean | 8.2% | 5.5% |
| Median | 6.3% | 5.2% |
| Interquartile 25% (IQ1) | 5.6% | 4.4% |
| Interquartile 75% (IQ3) | 8.0% | 7.1% |
| Interquartile Range (IQR) | 2.5% | 2.6% |
| Standard Deviation (Sample) | 5.7% | 2.0% |
| Standard Deviation (Population) | 5.7% | 2.0% |
Similar Demographics by Unemployment
Demographics Similar to Sub-Saharan Africans by Unemployment
In terms of unemployment, the demographic groups most similar to Sub-Saharan Africans are Immigrants from Uzbekistan (5.8%, a difference of 0.020%), Immigrants from Guatemala (5.8%, a difference of 0.040%), Immigrants from Bahamas (5.8%, a difference of 0.12%), Sierra Leonean (5.8%, a difference of 0.14%), and Salvadoran (5.8%, a difference of 0.17%).
| Demographics | Rating | Rank | Unemployment |
| Hondurans | 0.3 /100 | #252 | Tragic 5.7% |
| Central Americans | 0.3 /100 | #253 | Tragic 5.7% |
| Immigrants | Honduras | 0.3 /100 | #254 | Tragic 5.7% |
| Immigrants | Portugal | 0.2 /100 | #255 | Tragic 5.7% |
| Guatemalans | 0.2 /100 | #256 | Tragic 5.8% |
| Yaqui | 0.2 /100 | #257 | Tragic 5.8% |
| Immigrants | Bahamas | 0.1 /100 | #258 | Tragic 5.8% |
| Sub-Saharan Africans | 0.1 /100 | #259 | Tragic 5.8% |
| Immigrants | Uzbekistan | 0.1 /100 | #260 | Tragic 5.8% |
| Immigrants | Guatemala | 0.1 /100 | #261 | Tragic 5.8% |
| Sierra Leoneans | 0.1 /100 | #262 | Tragic 5.8% |
| Salvadorans | 0.1 /100 | #263 | Tragic 5.8% |
| Immigrants | Liberia | 0.1 /100 | #264 | Tragic 5.8% |
| Nigerians | 0.1 /100 | #265 | Tragic 5.8% |
| Mexican American Indians | 0.1 /100 | #266 | Tragic 5.8% |
Demographics Similar to Immigrants from Iran by Unemployment
In terms of unemployment, the demographic groups most similar to Immigrants from Iran are Immigrants from Iraq (5.4%, a difference of 0.020%), Portuguese (5.4%, a difference of 0.030%), Creek (5.4%, a difference of 0.060%), Iraqi (5.4%, a difference of 0.070%), and Ugandan (5.4%, a difference of 0.080%).
| Demographics | Rating | Rank | Unemployment |
| Cherokee | 25.5 /100 | #202 | Fair 5.3% |
| Immigrants | Micronesia | 25.2 /100 | #203 | Fair 5.3% |
| Immigrants | Ukraine | 24.9 /100 | #204 | Fair 5.3% |
| Native Hawaiians | 24.1 /100 | #205 | Fair 5.3% |
| Immigrants | Peru | 22.7 /100 | #206 | Fair 5.4% |
| Creek | 19.4 /100 | #207 | Poor 5.4% |
| Portuguese | 19.0 /100 | #208 | Poor 5.4% |
| Immigrants | Iran | 18.8 /100 | #209 | Poor 5.4% |
| Immigrants | Iraq | 18.6 /100 | #210 | Poor 5.4% |
| Iraqis | 18.1 /100 | #211 | Poor 5.4% |
| Ugandans | 18.0 /100 | #212 | Poor 5.4% |
| Immigrants | Middle Africa | 15.3 /100 | #213 | Poor 5.4% |
| Immigrants | Costa Rica | 15.2 /100 | #214 | Poor 5.4% |
| Delaware | 14.7 /100 | #215 | Poor 5.4% |
| Immigrants | South America | 13.5 /100 | #216 | Poor 5.4% |