Subsaharan African vs Immigrants from Kuwait Unemployment
COMPARE
Subsaharan African
Immigrants from Kuwait
Unemployment
Unemployment Comparison
Sub-Saharan Africans
Immigrants from Kuwait
5.8%
UNEMPLOYMENT
0.1/ 100
METRIC RATING
259th/ 347
METRIC RANK
5.0%
UNEMPLOYMENT
93.7/ 100
METRIC RATING
108th/ 347
METRIC RANK
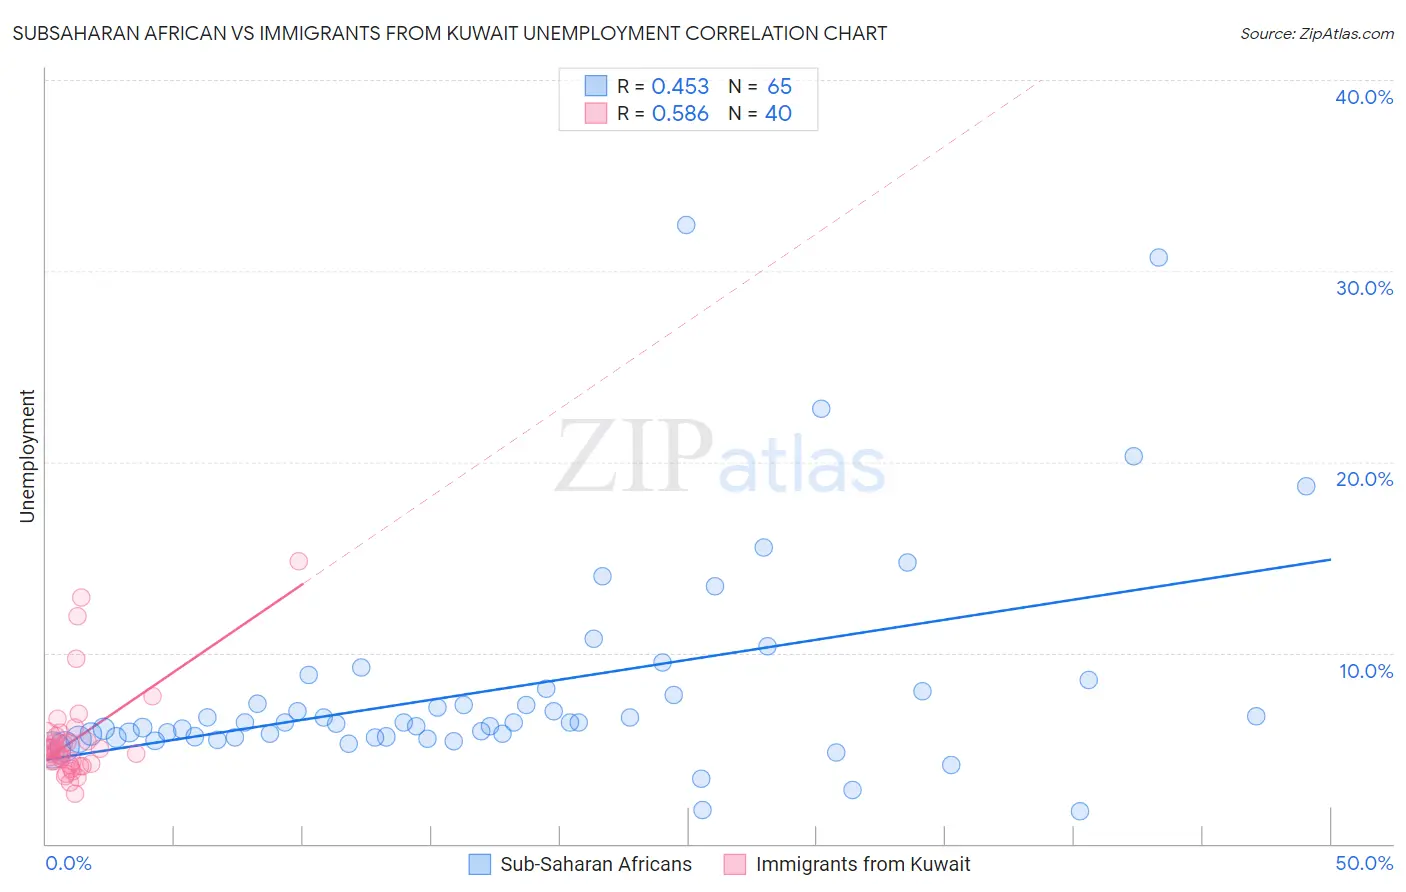
Subsaharan African vs Immigrants from Kuwait Unemployment Correlation Chart
The statistical analysis conducted on geographies consisting of 507,124,054 people shows a moderate positive correlation between the proportion of Sub-Saharan Africans and unemployment in the United States with a correlation coefficient (R) of 0.453 and weighted average of 5.8%. Similarly, the statistical analysis conducted on geographies consisting of 136,907,851 people shows a substantial positive correlation between the proportion of Immigrants from Kuwait and unemployment in the United States with a correlation coefficient (R) of 0.586 and weighted average of 5.0%, a difference of 14.9%.
Unemployment Correlation Summary
| Measurement | Subsaharan African | Immigrants from Kuwait |
| Minimum | 1.7% | 2.6% |
| Maximum | 32.4% | 14.8% |
| Range | 30.7% | 12.2% |
| Mean | 8.2% | 5.5% |
| Median | 6.3% | 4.8% |
| Interquartile 25% (IQ1) | 5.6% | 4.2% |
| Interquartile 75% (IQ3) | 8.0% | 5.6% |
| Interquartile Range (IQR) | 2.5% | 1.4% |
| Standard Deviation (Sample) | 5.7% | 2.6% |
| Standard Deviation (Population) | 5.7% | 2.5% |
Similar Demographics by Unemployment
Demographics Similar to Sub-Saharan Africans by Unemployment
In terms of unemployment, the demographic groups most similar to Sub-Saharan Africans are Immigrants from Uzbekistan (5.8%, a difference of 0.020%), Immigrants from Guatemala (5.8%, a difference of 0.040%), Immigrants from Bahamas (5.8%, a difference of 0.12%), Sierra Leonean (5.8%, a difference of 0.14%), and Salvadoran (5.8%, a difference of 0.17%).
| Demographics | Rating | Rank | Unemployment |
| Hondurans | 0.3 /100 | #252 | Tragic 5.7% |
| Central Americans | 0.3 /100 | #253 | Tragic 5.7% |
| Immigrants | Honduras | 0.3 /100 | #254 | Tragic 5.7% |
| Immigrants | Portugal | 0.2 /100 | #255 | Tragic 5.7% |
| Guatemalans | 0.2 /100 | #256 | Tragic 5.8% |
| Yaqui | 0.2 /100 | #257 | Tragic 5.8% |
| Immigrants | Bahamas | 0.1 /100 | #258 | Tragic 5.8% |
| Sub-Saharan Africans | 0.1 /100 | #259 | Tragic 5.8% |
| Immigrants | Uzbekistan | 0.1 /100 | #260 | Tragic 5.8% |
| Immigrants | Guatemala | 0.1 /100 | #261 | Tragic 5.8% |
| Sierra Leoneans | 0.1 /100 | #262 | Tragic 5.8% |
| Salvadorans | 0.1 /100 | #263 | Tragic 5.8% |
| Immigrants | Liberia | 0.1 /100 | #264 | Tragic 5.8% |
| Nigerians | 0.1 /100 | #265 | Tragic 5.8% |
| Mexican American Indians | 0.1 /100 | #266 | Tragic 5.8% |
Demographics Similar to Immigrants from Kuwait by Unemployment
In terms of unemployment, the demographic groups most similar to Immigrants from Kuwait are Immigrants from Turkey (5.0%, a difference of 0.010%), Immigrants from Romania (5.0%, a difference of 0.020%), Chickasaw (5.0%, a difference of 0.080%), Osage (5.0%, a difference of 0.080%), and Maltese (5.0%, a difference of 0.080%).
| Demographics | Rating | Rank | Unemployment |
| Americans | 94.3 /100 | #101 | Exceptional 5.0% |
| Immigrants | Argentina | 94.1 /100 | #102 | Exceptional 5.0% |
| Chickasaw | 94.0 /100 | #103 | Exceptional 5.0% |
| Osage | 94.0 /100 | #104 | Exceptional 5.0% |
| Maltese | 94.0 /100 | #105 | Exceptional 5.0% |
| Immigrants | Romania | 93.7 /100 | #106 | Exceptional 5.0% |
| Immigrants | Turkey | 93.7 /100 | #107 | Exceptional 5.0% |
| Immigrants | Kuwait | 93.7 /100 | #108 | Exceptional 5.0% |
| Immigrants | Eritrea | 93.3 /100 | #109 | Exceptional 5.0% |
| Immigrants | Lithuania | 93.2 /100 | #110 | Exceptional 5.0% |
| Chileans | 93.2 /100 | #111 | Exceptional 5.0% |
| South Africans | 92.6 /100 | #112 | Exceptional 5.1% |
| Argentineans | 92.4 /100 | #113 | Exceptional 5.1% |
| Immigrants | Ireland | 92.1 /100 | #114 | Exceptional 5.1% |
| Immigrants | Western Europe | 91.1 /100 | #115 | Exceptional 5.1% |