Sierra Leonean vs Yuman Female Unemployment
COMPARE
Sierra Leonean
Yuman
Female Unemployment
Female Unemployment Comparison
Sierra Leoneans
Yuman
5.5%
FEMALE UNEMPLOYMENT
3.2/ 100
METRIC RATING
238th/ 347
METRIC RANK
9.6%
FEMALE UNEMPLOYMENT
0.0/ 100
METRIC RATING
345th/ 347
METRIC RANK
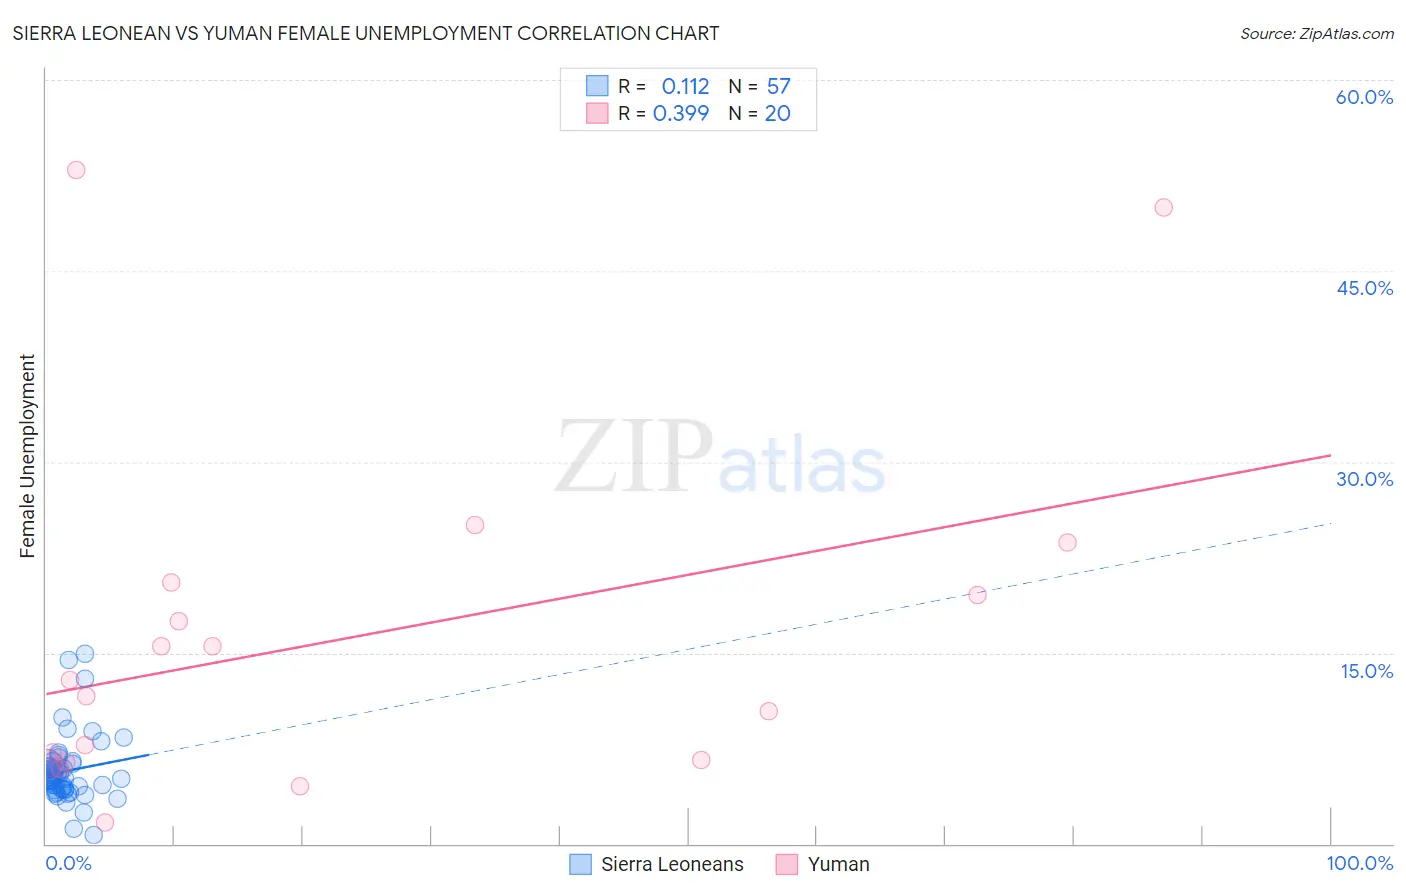
Sierra Leonean vs Yuman Female Unemployment Correlation Chart
The statistical analysis conducted on geographies consisting of 83,331,757 people shows a poor positive correlation between the proportion of Sierra Leoneans and unemploymnet rate among females in the United States with a correlation coefficient (R) of 0.112 and weighted average of 5.5%. Similarly, the statistical analysis conducted on geographies consisting of 40,628,844 people shows a mild positive correlation between the proportion of Yuman and unemploymnet rate among females in the United States with a correlation coefficient (R) of 0.399 and weighted average of 9.6%, a difference of 73.5%.
Female Unemployment Correlation Summary
| Measurement | Sierra Leonean | Yuman |
| Minimum | 0.70% | 1.7% |
| Maximum | 14.9% | 52.9% |
| Range | 14.2% | 51.2% |
| Mean | 5.7% | 16.1% |
| Median | 5.2% | 12.2% |
| Interquartile 25% (IQ1) | 4.3% | 6.5% |
| Interquartile 75% (IQ3) | 6.2% | 20.0% |
| Interquartile Range (IQR) | 1.9% | 13.5% |
| Standard Deviation (Sample) | 2.6% | 13.8% |
| Standard Deviation (Population) | 2.6% | 13.4% |
Similar Demographics by Female Unemployment
Demographics Similar to Sierra Leoneans by Female Unemployment
In terms of female unemployment, the demographic groups most similar to Sierra Leoneans are Immigrants from Panama (5.5%, a difference of 0.020%), Immigrants from Cambodia (5.5%, a difference of 0.040%), Immigrants from Lebanon (5.5%, a difference of 0.080%), Immigrants from Iran (5.5%, a difference of 0.080%), and Moroccan (5.5%, a difference of 0.10%).
| Demographics | Rating | Rank | Female Unemployment |
| Immigrants | Iraq | 3.9 /100 | #231 | Tragic 5.5% |
| Liberians | 3.9 /100 | #232 | Tragic 5.5% |
| Moroccans | 3.4 /100 | #233 | Tragic 5.5% |
| Immigrants | Lebanon | 3.3 /100 | #234 | Tragic 5.5% |
| Immigrants | Iran | 3.3 /100 | #235 | Tragic 5.5% |
| Immigrants | Cambodia | 3.3 /100 | #236 | Tragic 5.5% |
| Immigrants | Panama | 3.2 /100 | #237 | Tragic 5.5% |
| Sierra Leoneans | 3.2 /100 | #238 | Tragic 5.5% |
| Aleuts | 3.0 /100 | #239 | Tragic 5.5% |
| Immigrants | South America | 2.9 /100 | #240 | Tragic 5.5% |
| South American Indians | 2.8 /100 | #241 | Tragic 5.5% |
| Marshallese | 2.3 /100 | #242 | Tragic 5.6% |
| Spanish Americans | 2.2 /100 | #243 | Tragic 5.6% |
| Immigrants | Liberia | 1.5 /100 | #244 | Tragic 5.6% |
| Guamanians/Chamorros | 1.4 /100 | #245 | Tragic 5.6% |
Demographics Similar to Yuman by Female Unemployment
In terms of female unemployment, the demographic groups most similar to Yuman are Pima (9.3%, a difference of 2.8%), Arapaho (8.8%, a difference of 9.1%), Yup'ik (10.9%, a difference of 13.4%), Puerto Rican (8.3%, a difference of 15.0%), and Inupiat (8.2%, a difference of 17.6%).
| Demographics | Rating | Rank | Female Unemployment |
| Menominee | 0.0 /100 | #333 | Tragic 7.0% |
| Immigrants | Armenia | 0.0 /100 | #334 | Tragic 7.1% |
| Dominicans | 0.0 /100 | #335 | Tragic 7.2% |
| Immigrants | Dominican Republic | 0.0 /100 | #336 | Tragic 7.2% |
| Navajo | 0.0 /100 | #337 | Tragic 7.3% |
| Tohono O'odham | 0.0 /100 | #338 | Tragic 7.7% |
| Immigrants | Yemen | 0.0 /100 | #339 | Tragic 7.8% |
| Hopi | 0.0 /100 | #340 | Tragic 8.1% |
| Inupiat | 0.0 /100 | #341 | Tragic 8.2% |
| Puerto Ricans | 0.0 /100 | #342 | Tragic 8.3% |
| Arapaho | 0.0 /100 | #343 | Tragic 8.8% |
| Pima | 0.0 /100 | #344 | Tragic 9.3% |
| Yuman | 0.0 /100 | #345 | Tragic 9.6% |
| Yup'ik | 0.0 /100 | #346 | Tragic 10.9% |
| Crow | 0.0 /100 | #347 | Tragic 12.1% |