Sierra Leonean vs Immigrants from Oceania Cognitive Disability
COMPARE
Sierra Leonean
Immigrants from Oceania
Cognitive Disability
Cognitive Disability Comparison
Sierra Leoneans
Immigrants from Oceania
17.9%
COGNITIVE DISABILITY
0.4/ 100
METRIC RATING
262nd/ 347
METRIC RANK
17.6%
COGNITIVE DISABILITY
7.3/ 100
METRIC RATING
212th/ 347
METRIC RANK
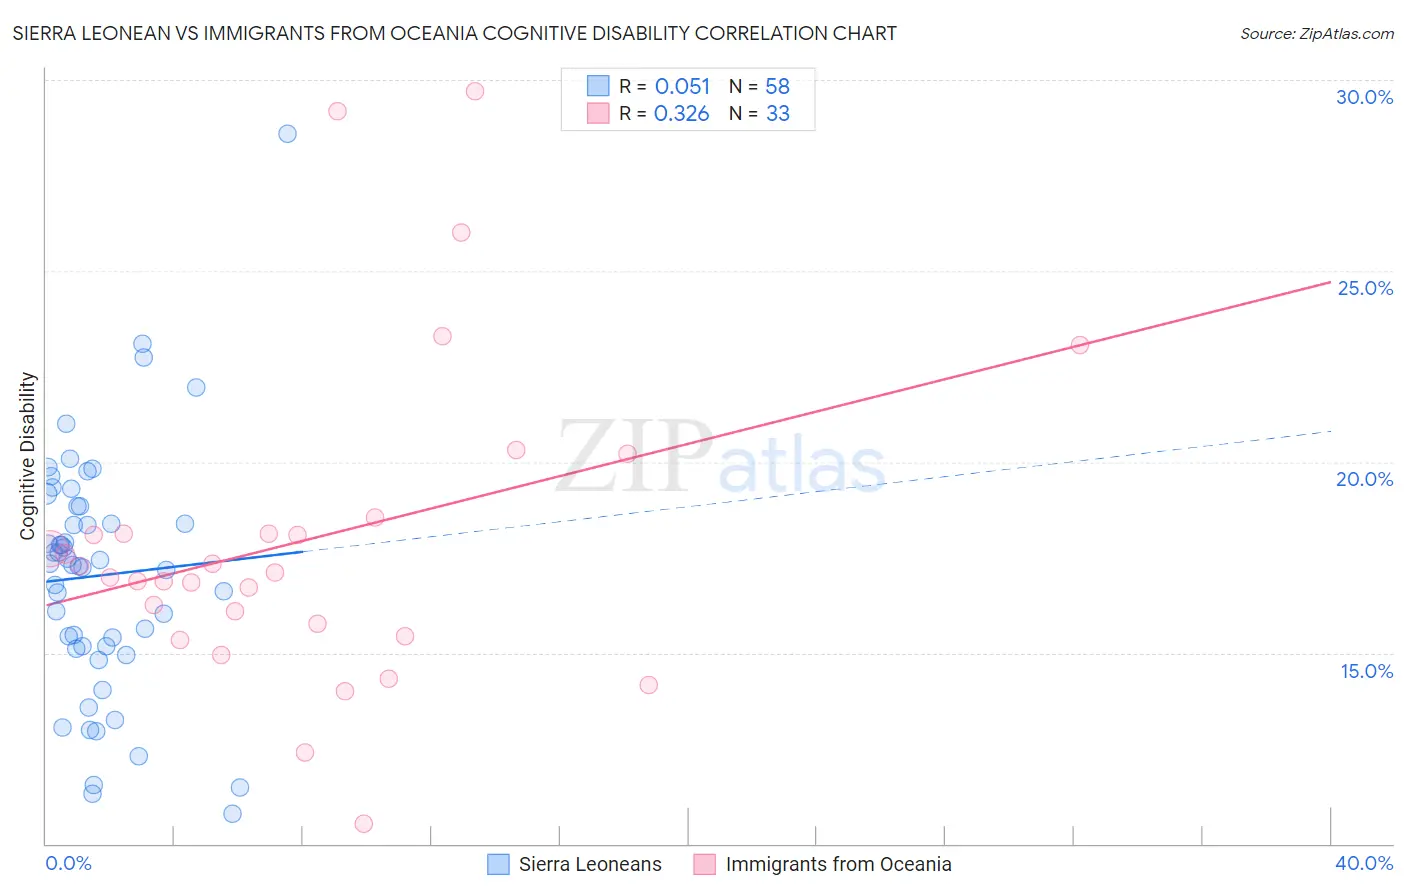
Sierra Leonean vs Immigrants from Oceania Cognitive Disability Correlation Chart
The statistical analysis conducted on geographies consisting of 83,361,112 people shows a slight positive correlation between the proportion of Sierra Leoneans and percentage of population with cognitive disability in the United States with a correlation coefficient (R) of 0.051 and weighted average of 17.9%. Similarly, the statistical analysis conducted on geographies consisting of 305,496,536 people shows a mild positive correlation between the proportion of Immigrants from Oceania and percentage of population with cognitive disability in the United States with a correlation coefficient (R) of 0.326 and weighted average of 17.6%, a difference of 2.0%.
Cognitive Disability Correlation Summary
| Measurement | Sierra Leonean | Immigrants from Oceania |
| Minimum | 10.8% | 10.5% |
| Maximum | 28.6% | 29.7% |
| Range | 17.8% | 19.2% |
| Mean | 17.0% | 18.0% |
| Median | 17.3% | 17.1% |
| Interquartile 25% (IQ1) | 15.2% | 15.6% |
| Interquartile 75% (IQ3) | 18.8% | 18.3% |
| Interquartile Range (IQR) | 3.7% | 2.7% |
| Standard Deviation (Sample) | 3.2% | 4.2% |
| Standard Deviation (Population) | 3.2% | 4.1% |
Similar Demographics by Cognitive Disability
Demographics Similar to Sierra Leoneans by Cognitive Disability
In terms of cognitive disability, the demographic groups most similar to Sierra Leoneans are Guamanian/Chamorro (17.9%, a difference of 0.030%), Immigrants from Barbados (17.9%, a difference of 0.040%), Immigrants from Belize (17.9%, a difference of 0.080%), Ethiopian (17.9%, a difference of 0.090%), and Menominee (18.0%, a difference of 0.10%).
| Demographics | Rating | Rank | Cognitive Disability |
| Immigrants | Azores | 0.6 /100 | #255 | Tragic 17.9% |
| Bahamians | 0.6 /100 | #256 | Tragic 17.9% |
| Mexican American Indians | 0.6 /100 | #257 | Tragic 17.9% |
| Immigrants | Armenia | 0.6 /100 | #258 | Tragic 17.9% |
| Ethiopians | 0.5 /100 | #259 | Tragic 17.9% |
| Immigrants | Belize | 0.5 /100 | #260 | Tragic 17.9% |
| Guamanians/Chamorros | 0.5 /100 | #261 | Tragic 17.9% |
| Sierra Leoneans | 0.4 /100 | #262 | Tragic 17.9% |
| Immigrants | Barbados | 0.4 /100 | #263 | Tragic 17.9% |
| Menominee | 0.4 /100 | #264 | Tragic 18.0% |
| Spanish Americans | 0.4 /100 | #265 | Tragic 18.0% |
| Belizeans | 0.4 /100 | #266 | Tragic 18.0% |
| Nepalese | 0.3 /100 | #267 | Tragic 18.0% |
| Cherokee | 0.3 /100 | #268 | Tragic 18.0% |
| Hondurans | 0.3 /100 | #269 | Tragic 18.0% |
Demographics Similar to Immigrants from Oceania by Cognitive Disability
In terms of cognitive disability, the demographic groups most similar to Immigrants from Oceania are Hawaiian (17.6%, a difference of 0.010%), Taiwanese (17.6%, a difference of 0.040%), Immigrants from El Salvador (17.6%, a difference of 0.040%), Alaskan Athabascan (17.6%, a difference of 0.050%), and Okinawan (17.6%, a difference of 0.050%).
| Demographics | Rating | Rank | Cognitive Disability |
| Puget Sound Salish | 10.9 /100 | #205 | Poor 17.5% |
| Alaska Natives | 10.4 /100 | #206 | Poor 17.5% |
| Immigrants | Latin America | 9.7 /100 | #207 | Tragic 17.6% |
| Immigrants | Cameroon | 9.3 /100 | #208 | Tragic 17.6% |
| Immigrants | Trinidad and Tobago | 8.7 /100 | #209 | Tragic 17.6% |
| Immigrants | Jamaica | 8.5 /100 | #210 | Tragic 17.6% |
| Taiwanese | 7.7 /100 | #211 | Tragic 17.6% |
| Immigrants | Oceania | 7.3 /100 | #212 | Tragic 17.6% |
| Hawaiians | 7.2 /100 | #213 | Tragic 17.6% |
| Immigrants | El Salvador | 7.0 /100 | #214 | Tragic 17.6% |
| Alaskan Athabascans | 6.9 /100 | #215 | Tragic 17.6% |
| Okinawans | 6.8 /100 | #216 | Tragic 17.6% |
| Salvadorans | 6.7 /100 | #217 | Tragic 17.6% |
| Icelanders | 6.4 /100 | #218 | Tragic 17.6% |
| Immigrants | Sierra Leone | 6.3 /100 | #219 | Tragic 17.6% |