Norwegian vs Zimbabwean Unemployment
COMPARE
Norwegian
Zimbabwean
Unemployment
Unemployment Comparison
Norwegians
Zimbabweans
4.2%
UNEMPLOYMENT
100.0/ 100
METRIC RATING
1st/ 347
METRIC RANK
4.8%
UNEMPLOYMENT
99.8/ 100
METRIC RATING
32nd/ 347
METRIC RANK
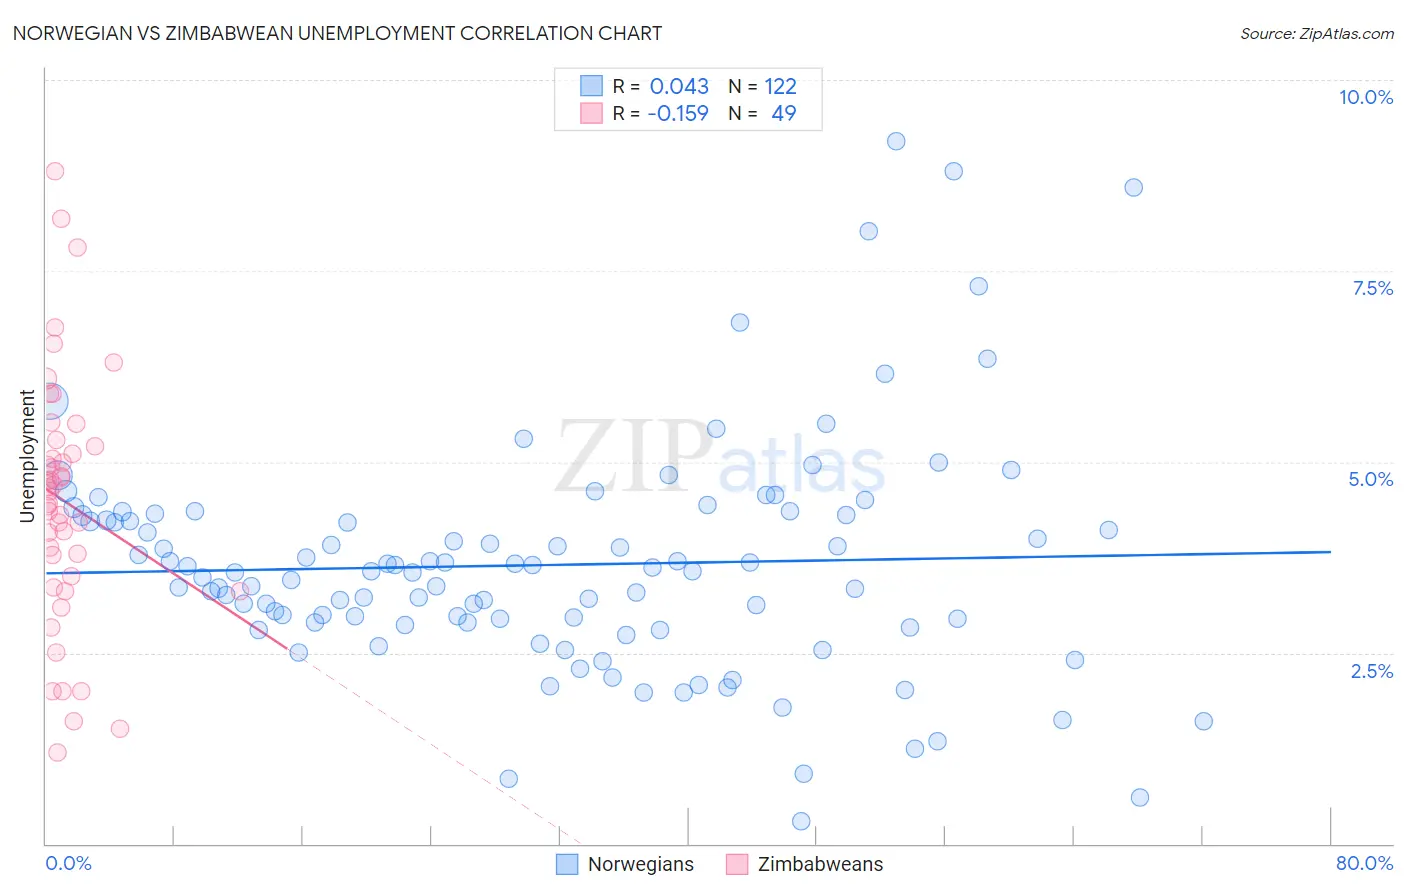
Norwegian vs Zimbabwean Unemployment Correlation Chart
The statistical analysis conducted on geographies consisting of 530,614,839 people shows no correlation between the proportion of Norwegians and unemployment in the United States with a correlation coefficient (R) of 0.043 and weighted average of 4.2%. Similarly, the statistical analysis conducted on geographies consisting of 69,206,106 people shows a poor negative correlation between the proportion of Zimbabweans and unemployment in the United States with a correlation coefficient (R) of -0.159 and weighted average of 4.8%, a difference of 13.5%.
Unemployment Correlation Summary
| Measurement | Norwegian | Zimbabwean |
| Minimum | 0.30% | 1.2% |
| Maximum | 9.2% | 8.8% |
| Range | 8.9% | 7.6% |
| Mean | 3.6% | 4.5% |
| Median | 3.6% | 4.6% |
| Interquartile 25% (IQ1) | 2.9% | 3.4% |
| Interquartile 75% (IQ3) | 4.3% | 5.2% |
| Interquartile Range (IQR) | 1.4% | 1.8% |
| Standard Deviation (Sample) | 1.5% | 1.6% |
| Standard Deviation (Population) | 1.5% | 1.6% |
Similar Demographics by Unemployment
Demographics Similar to Norwegians by Unemployment
In terms of unemployment, the demographic groups most similar to Norwegians are Luxembourger (4.3%, a difference of 3.4%), Czech (4.3%, a difference of 3.5%), Danish (4.3%, a difference of 3.6%), Swedish (4.4%, a difference of 6.0%), and German (4.5%, a difference of 6.9%).
| Demographics | Rating | Rank | Unemployment |
| Norwegians | 100.0 /100 | #1 | Exceptional 4.2% |
| Luxembourgers | 100.0 /100 | #2 | Exceptional 4.3% |
| Czechs | 100.0 /100 | #3 | Exceptional 4.3% |
| Danes | 100.0 /100 | #4 | Exceptional 4.3% |
| Swedes | 100.0 /100 | #5 | Exceptional 4.4% |
| Germans | 100.0 /100 | #6 | Exceptional 4.5% |
| Immigrants | India | 100.0 /100 | #7 | Exceptional 4.5% |
| Swiss | 100.0 /100 | #8 | Exceptional 4.5% |
| Scandinavians | 100.0 /100 | #9 | Exceptional 4.5% |
| Dutch | 100.0 /100 | #10 | Exceptional 4.6% |
| English | 100.0 /100 | #11 | Exceptional 4.6% |
| Pennsylvania Germans | 100.0 /100 | #12 | Exceptional 4.6% |
| Belgians | 100.0 /100 | #13 | Exceptional 4.6% |
| Immigrants | Cuba | 100.0 /100 | #14 | Exceptional 4.6% |
| Europeans | 99.9 /100 | #15 | Exceptional 4.6% |
Demographics Similar to Zimbabweans by Unemployment
In terms of unemployment, the demographic groups most similar to Zimbabweans are Sudanese (4.8%, a difference of 0.010%), Immigrants from Bolivia (4.8%, a difference of 0.050%), Croatian (4.8%, a difference of 0.10%), Irish (4.8%, a difference of 0.12%), and Scotch-Irish (4.8%, a difference of 0.12%).
| Demographics | Rating | Rank | Unemployment |
| Latvians | 99.9 /100 | #25 | Exceptional 4.7% |
| Bulgarians | 99.9 /100 | #26 | Exceptional 4.7% |
| Finns | 99.9 /100 | #27 | Exceptional 4.7% |
| Cubans | 99.8 /100 | #28 | Exceptional 4.7% |
| Poles | 99.8 /100 | #29 | Exceptional 4.7% |
| Irish | 99.8 /100 | #30 | Exceptional 4.8% |
| Croatians | 99.8 /100 | #31 | Exceptional 4.8% |
| Zimbabweans | 99.8 /100 | #32 | Exceptional 4.8% |
| Sudanese | 99.8 /100 | #33 | Exceptional 4.8% |
| Immigrants | Bolivia | 99.8 /100 | #34 | Exceptional 4.8% |
| Scotch-Irish | 99.8 /100 | #35 | Exceptional 4.8% |
| Tongans | 99.7 /100 | #36 | Exceptional 4.8% |
| Czechoslovakians | 99.7 /100 | #37 | Exceptional 4.8% |
| Bolivians | 99.7 /100 | #38 | Exceptional 4.8% |
| Lithuanians | 99.7 /100 | #39 | Exceptional 4.8% |