Norwegian vs Zimbabwean Child Poverty Among Girls Under 16
COMPARE
Norwegian
Zimbabwean
Child Poverty Among Girls Under 16
Child Poverty Among Girls Under 16 Comparison
Norwegians
Zimbabweans
13.3%
CHILD POVERTY AMONG GIRLS UNDER 16
99.9/ 100
METRIC RATING
23rd/ 347
METRIC RANK
14.4%
CHILD POVERTY AMONG GIRLS UNDER 16
98.8/ 100
METRIC RATING
59th/ 347
METRIC RANK
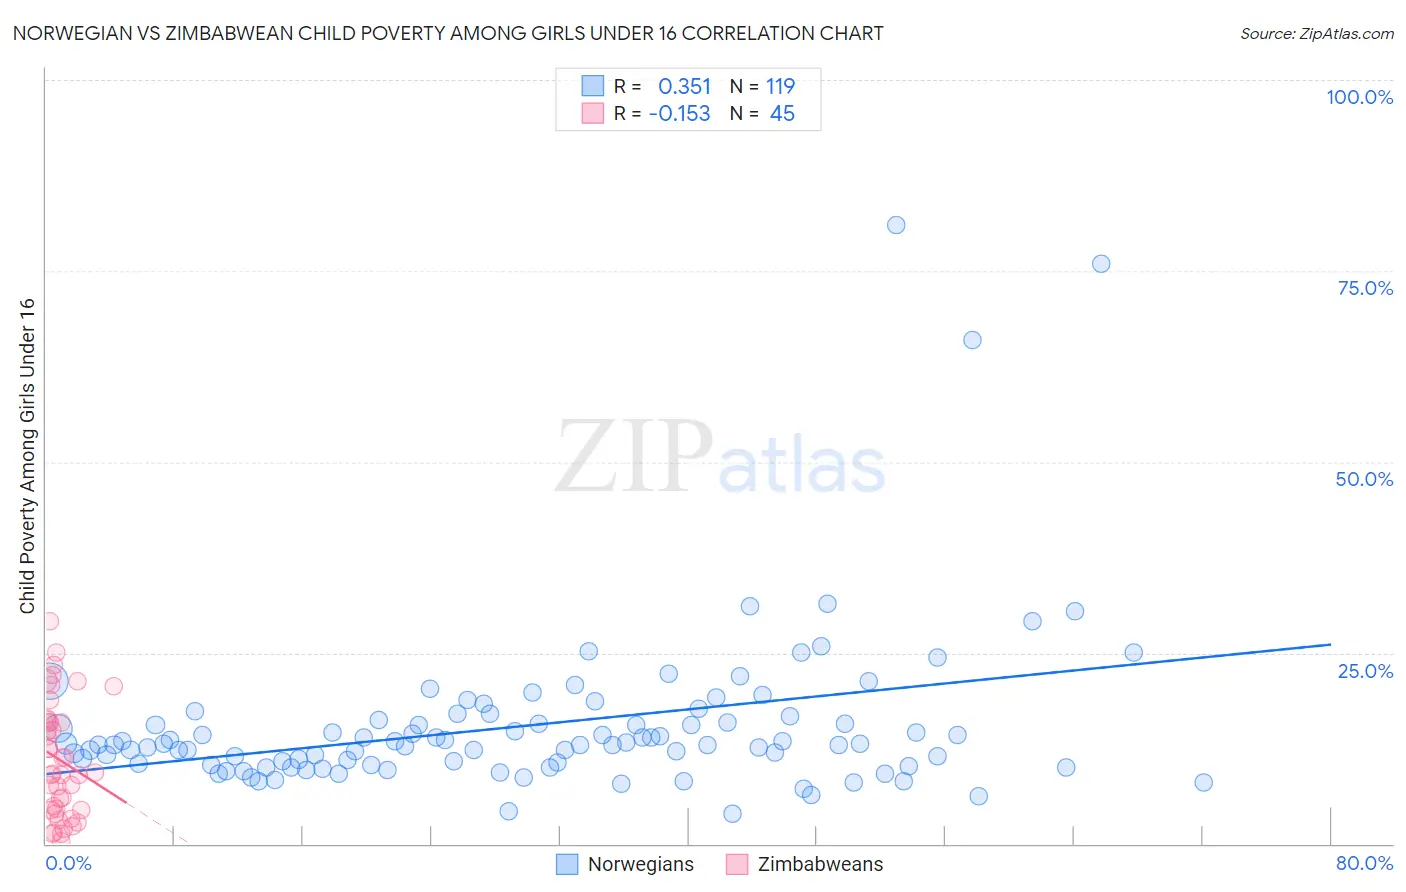
Norwegian vs Zimbabwean Child Poverty Among Girls Under 16 Correlation Chart
The statistical analysis conducted on geographies consisting of 514,648,663 people shows a mild positive correlation between the proportion of Norwegians and poverty level among girls under the age of 16 in the United States with a correlation coefficient (R) of 0.351 and weighted average of 13.3%. Similarly, the statistical analysis conducted on geographies consisting of 69,044,520 people shows a poor negative correlation between the proportion of Zimbabweans and poverty level among girls under the age of 16 in the United States with a correlation coefficient (R) of -0.153 and weighted average of 14.4%, a difference of 7.7%.
Child Poverty Among Girls Under 16 Correlation Summary
| Measurement | Norwegian | Zimbabwean |
| Minimum | 3.9% | 0.32% |
| Maximum | 81.0% | 29.1% |
| Range | 77.1% | 28.8% |
| Mean | 15.5% | 11.0% |
| Median | 13.0% | 9.2% |
| Interquartile 25% (IQ1) | 10.4% | 4.4% |
| Interquartile 75% (IQ3) | 16.2% | 16.0% |
| Interquartile Range (IQR) | 5.8% | 11.7% |
| Standard Deviation (Sample) | 10.9% | 7.5% |
| Standard Deviation (Population) | 10.9% | 7.4% |
Similar Demographics by Child Poverty Among Girls Under 16
Demographics Similar to Norwegians by Child Poverty Among Girls Under 16
In terms of child poverty among girls under 16, the demographic groups most similar to Norwegians are Immigrants from Eastern Asia (13.4%, a difference of 0.090%), Indian (Asian) (13.3%, a difference of 0.17%), Assyrian/Chaldean/Syriac (13.3%, a difference of 0.37%), Immigrants from Japan (13.3%, a difference of 0.49%), and Immigrants from China (13.4%, a difference of 0.55%).
| Demographics | Rating | Rank | Child Poverty Among Girls Under 16 |
| Immigrants | Lithuania | 99.9 /100 | #16 | Exceptional 13.1% |
| Bulgarians | 99.9 /100 | #17 | Exceptional 13.1% |
| Immigrants | Korea | 99.9 /100 | #18 | Exceptional 13.1% |
| Cypriots | 99.9 /100 | #19 | Exceptional 13.2% |
| Immigrants | Japan | 99.9 /100 | #20 | Exceptional 13.3% |
| Assyrians/Chaldeans/Syriacs | 99.9 /100 | #21 | Exceptional 13.3% |
| Indians (Asian) | 99.9 /100 | #22 | Exceptional 13.3% |
| Norwegians | 99.9 /100 | #23 | Exceptional 13.3% |
| Immigrants | Eastern Asia | 99.9 /100 | #24 | Exceptional 13.4% |
| Immigrants | China | 99.8 /100 | #25 | Exceptional 13.4% |
| Eastern Europeans | 99.8 /100 | #26 | Exceptional 13.5% |
| Latvians | 99.8 /100 | #27 | Exceptional 13.5% |
| Tongans | 99.8 /100 | #28 | Exceptional 13.6% |
| Bolivians | 99.8 /100 | #29 | Exceptional 13.6% |
| Asians | 99.7 /100 | #30 | Exceptional 13.7% |
Demographics Similar to Zimbabweans by Child Poverty Among Girls Under 16
In terms of child poverty among girls under 16, the demographic groups most similar to Zimbabweans are Immigrants from Bulgaria (14.4%, a difference of 0.060%), Immigrants from Serbia (14.4%, a difference of 0.15%), Immigrants from Indonesia (14.4%, a difference of 0.19%), Polish (14.4%, a difference of 0.19%), and Cambodian (14.4%, a difference of 0.20%).
| Demographics | Rating | Rank | Child Poverty Among Girls Under 16 |
| Italians | 99.1 /100 | #52 | Exceptional 14.3% |
| Luxembourgers | 99.0 /100 | #53 | Exceptional 14.3% |
| Estonians | 98.9 /100 | #54 | Exceptional 14.3% |
| Immigrants | Romania | 98.9 /100 | #55 | Exceptional 14.3% |
| Immigrants | Indonesia | 98.9 /100 | #56 | Exceptional 14.4% |
| Immigrants | Serbia | 98.9 /100 | #57 | Exceptional 14.4% |
| Immigrants | Bulgaria | 98.8 /100 | #58 | Exceptional 14.4% |
| Zimbabweans | 98.8 /100 | #59 | Exceptional 14.4% |
| Poles | 98.7 /100 | #60 | Exceptional 14.4% |
| Cambodians | 98.7 /100 | #61 | Exceptional 14.4% |
| Scandinavians | 98.7 /100 | #62 | Exceptional 14.4% |
| Immigrants | Europe | 98.7 /100 | #63 | Exceptional 14.4% |
| Immigrants | Philippines | 98.6 /100 | #64 | Exceptional 14.4% |
| Immigrants | Sweden | 98.6 /100 | #65 | Exceptional 14.5% |
| Immigrants | Belgium | 98.5 /100 | #66 | Exceptional 14.5% |