Norwegian vs Yakama Unemployment
COMPARE
Norwegian
Yakama
Unemployment
Unemployment Comparison
Norwegians
Yakama
4.2%
UNEMPLOYMENT
100.0/ 100
METRIC RATING
1st/ 347
METRIC RANK
7.3%
UNEMPLOYMENT
0.0/ 100
METRIC RATING
330th/ 347
METRIC RANK
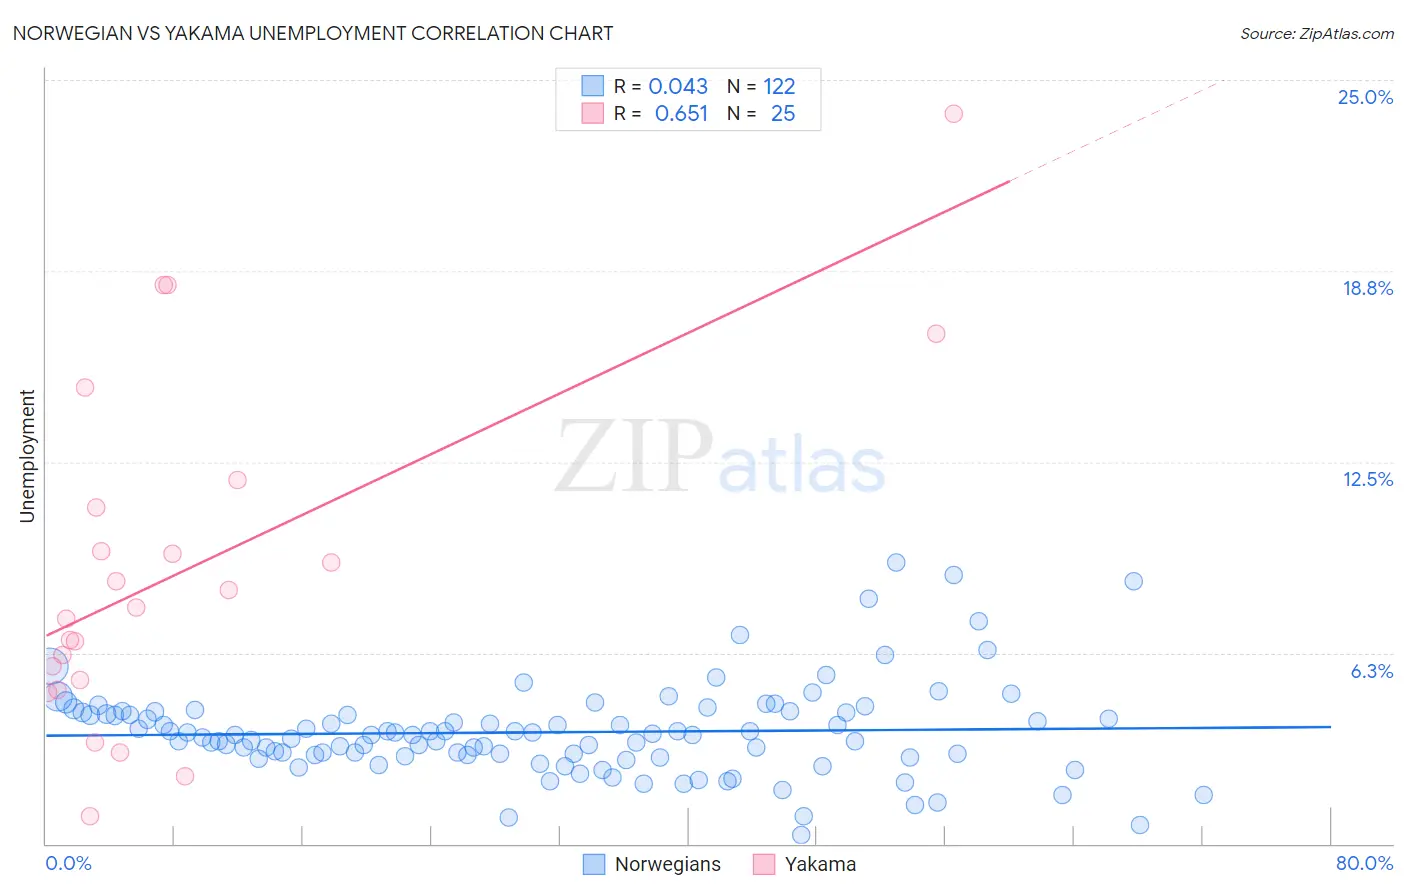
Norwegian vs Yakama Unemployment Correlation Chart
The statistical analysis conducted on geographies consisting of 530,614,839 people shows no correlation between the proportion of Norwegians and unemployment in the United States with a correlation coefficient (R) of 0.043 and weighted average of 4.2%. Similarly, the statistical analysis conducted on geographies consisting of 19,909,925 people shows a significant positive correlation between the proportion of Yakama and unemployment in the United States with a correlation coefficient (R) of 0.651 and weighted average of 7.3%, a difference of 74.8%.
Unemployment Correlation Summary
| Measurement | Norwegian | Yakama |
| Minimum | 0.30% | 0.90% |
| Maximum | 9.2% | 23.9% |
| Range | 8.9% | 23.0% |
| Mean | 3.6% | 9.0% |
| Median | 3.6% | 7.7% |
| Interquartile 25% (IQ1) | 2.9% | 5.2% |
| Interquartile 75% (IQ3) | 4.3% | 11.5% |
| Interquartile Range (IQR) | 1.4% | 6.3% |
| Standard Deviation (Sample) | 1.5% | 5.6% |
| Standard Deviation (Population) | 1.5% | 5.5% |
Similar Demographics by Unemployment
Demographics Similar to Norwegians by Unemployment
In terms of unemployment, the demographic groups most similar to Norwegians are Luxembourger (4.3%, a difference of 3.4%), Czech (4.3%, a difference of 3.5%), Danish (4.3%, a difference of 3.6%), Swedish (4.4%, a difference of 6.0%), and German (4.5%, a difference of 6.9%).
| Demographics | Rating | Rank | Unemployment |
| Norwegians | 100.0 /100 | #1 | Exceptional 4.2% |
| Luxembourgers | 100.0 /100 | #2 | Exceptional 4.3% |
| Czechs | 100.0 /100 | #3 | Exceptional 4.3% |
| Danes | 100.0 /100 | #4 | Exceptional 4.3% |
| Swedes | 100.0 /100 | #5 | Exceptional 4.4% |
| Germans | 100.0 /100 | #6 | Exceptional 4.5% |
| Immigrants | India | 100.0 /100 | #7 | Exceptional 4.5% |
| Swiss | 100.0 /100 | #8 | Exceptional 4.5% |
| Scandinavians | 100.0 /100 | #9 | Exceptional 4.5% |
| Dutch | 100.0 /100 | #10 | Exceptional 4.6% |
| English | 100.0 /100 | #11 | Exceptional 4.6% |
| Pennsylvania Germans | 100.0 /100 | #12 | Exceptional 4.6% |
| Belgians | 100.0 /100 | #13 | Exceptional 4.6% |
| Immigrants | Cuba | 100.0 /100 | #14 | Exceptional 4.6% |
| Europeans | 99.9 /100 | #15 | Exceptional 4.6% |
Demographics Similar to Yakama by Unemployment
In terms of unemployment, the demographic groups most similar to Yakama are Dominican (7.4%, a difference of 0.33%), Sioux (7.4%, a difference of 0.76%), Immigrants from Dominican Republic (7.4%, a difference of 0.82%), Alaska Native (7.2%, a difference of 1.3%), and Apache (7.4%, a difference of 1.3%).
| Demographics | Rating | Rank | Unemployment |
| Immigrants | Grenada | 0.0 /100 | #323 | Tragic 6.9% |
| Immigrants | Armenia | 0.0 /100 | #324 | Tragic 7.0% |
| Natives/Alaskans | 0.0 /100 | #325 | Tragic 7.0% |
| Paiute | 0.0 /100 | #326 | Tragic 7.1% |
| Pueblo | 0.0 /100 | #327 | Tragic 7.2% |
| Tsimshian | 0.0 /100 | #328 | Tragic 7.2% |
| Alaska Natives | 0.0 /100 | #329 | Tragic 7.2% |
| Yakama | 0.0 /100 | #330 | Tragic 7.3% |
| Dominicans | 0.0 /100 | #331 | Tragic 7.4% |
| Sioux | 0.0 /100 | #332 | Tragic 7.4% |
| Immigrants | Dominican Republic | 0.0 /100 | #333 | Tragic 7.4% |
| Apache | 0.0 /100 | #334 | Tragic 7.4% |
| Alaskan Athabascans | 0.0 /100 | #335 | Tragic 7.7% |
| Immigrants | Yemen | 0.0 /100 | #336 | Tragic 7.7% |
| Cheyenne | 0.0 /100 | #337 | Tragic 8.0% |