Norwegian vs Romanian Unemployment
COMPARE
Norwegian
Romanian
Unemployment
Unemployment Comparison
Norwegians
Romanians
4.2%
UNEMPLOYMENT
100.0/ 100
METRIC RATING
1st/ 347
METRIC RANK
5.0%
UNEMPLOYMENT
95.0/ 100
METRIC RATING
98th/ 347
METRIC RANK
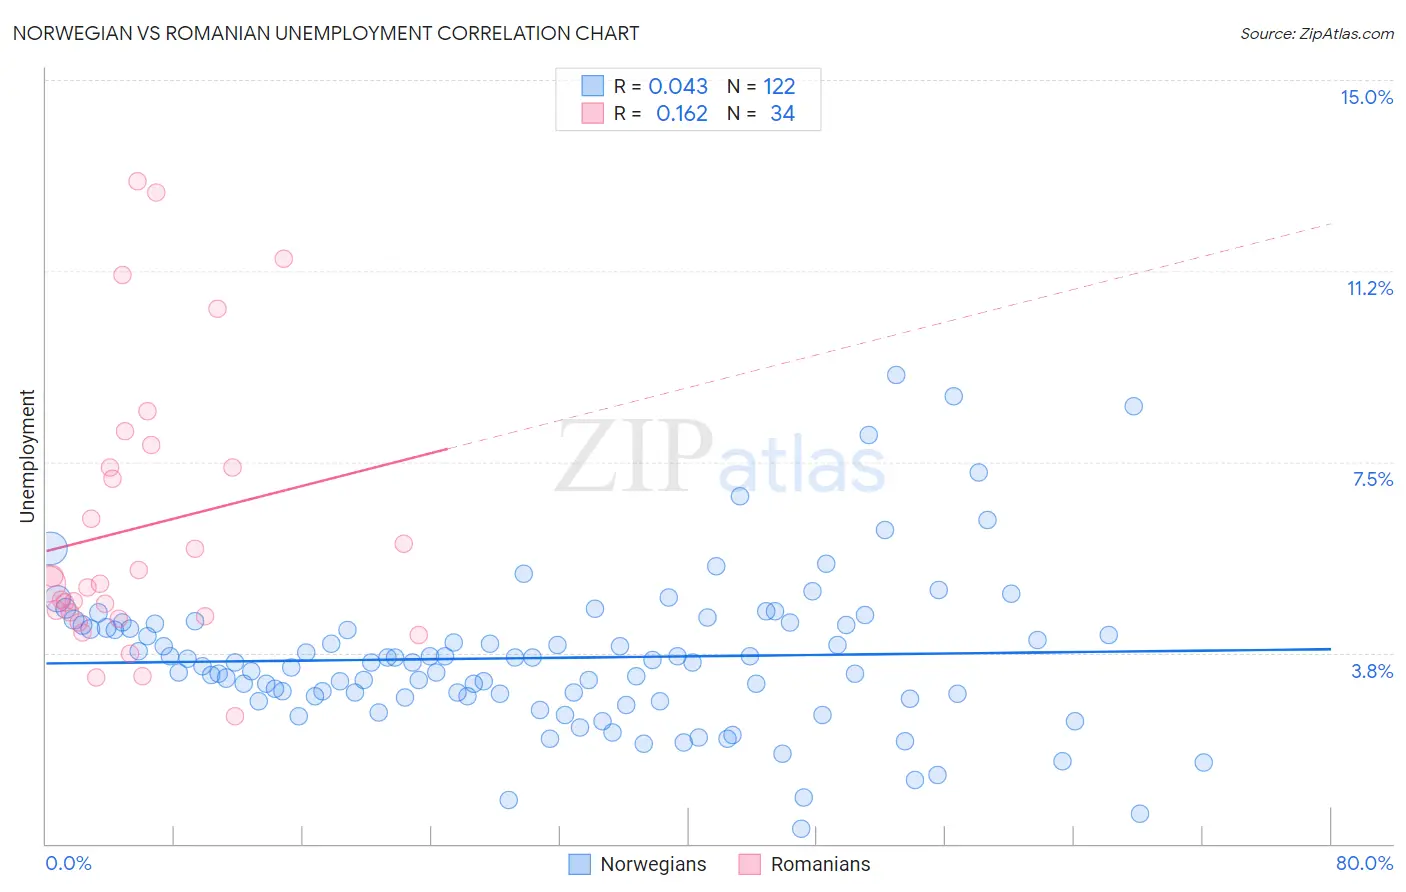
Norwegian vs Romanian Unemployment Correlation Chart
The statistical analysis conducted on geographies consisting of 530,614,839 people shows no correlation between the proportion of Norwegians and unemployment in the United States with a correlation coefficient (R) of 0.043 and weighted average of 4.2%. Similarly, the statistical analysis conducted on geographies consisting of 377,537,614 people shows a poor positive correlation between the proportion of Romanians and unemployment in the United States with a correlation coefficient (R) of 0.162 and weighted average of 5.0%, a difference of 19.7%.
Unemployment Correlation Summary
| Measurement | Norwegian | Romanian |
| Minimum | 0.30% | 2.5% |
| Maximum | 9.2% | 13.0% |
| Range | 8.9% | 10.5% |
| Mean | 3.6% | 6.2% |
| Median | 3.6% | 5.1% |
| Interquartile 25% (IQ1) | 2.9% | 4.5% |
| Interquartile 75% (IQ3) | 4.3% | 7.4% |
| Interquartile Range (IQR) | 1.4% | 2.9% |
| Standard Deviation (Sample) | 1.5% | 2.8% |
| Standard Deviation (Population) | 1.5% | 2.7% |
Similar Demographics by Unemployment
Demographics Similar to Norwegians by Unemployment
In terms of unemployment, the demographic groups most similar to Norwegians are Luxembourger (4.3%, a difference of 3.4%), Czech (4.3%, a difference of 3.5%), Danish (4.3%, a difference of 3.6%), Swedish (4.4%, a difference of 6.0%), and German (4.5%, a difference of 6.9%).
| Demographics | Rating | Rank | Unemployment |
| Norwegians | 100.0 /100 | #1 | Exceptional 4.2% |
| Luxembourgers | 100.0 /100 | #2 | Exceptional 4.3% |
| Czechs | 100.0 /100 | #3 | Exceptional 4.3% |
| Danes | 100.0 /100 | #4 | Exceptional 4.3% |
| Swedes | 100.0 /100 | #5 | Exceptional 4.4% |
| Germans | 100.0 /100 | #6 | Exceptional 4.5% |
| Immigrants | India | 100.0 /100 | #7 | Exceptional 4.5% |
| Swiss | 100.0 /100 | #8 | Exceptional 4.5% |
| Scandinavians | 100.0 /100 | #9 | Exceptional 4.5% |
| Dutch | 100.0 /100 | #10 | Exceptional 4.6% |
| English | 100.0 /100 | #11 | Exceptional 4.6% |
| Pennsylvania Germans | 100.0 /100 | #12 | Exceptional 4.6% |
| Belgians | 100.0 /100 | #13 | Exceptional 4.6% |
| Immigrants | Cuba | 100.0 /100 | #14 | Exceptional 4.6% |
| Europeans | 99.9 /100 | #15 | Exceptional 4.6% |
Demographics Similar to Romanians by Unemployment
In terms of unemployment, the demographic groups most similar to Romanians are Immigrants from Czechoslovakia (5.0%, a difference of 0.030%), Immigrants from England (5.0%, a difference of 0.060%), Mongolian (5.0%, a difference of 0.070%), Estonian (5.0%, a difference of 0.13%), and Immigrants from Serbia (5.0%, a difference of 0.22%).
| Demographics | Rating | Rank | Unemployment |
| Immigrants | Sudan | 96.3 /100 | #91 | Exceptional 5.0% |
| Immigrants | South Africa | 96.2 /100 | #92 | Exceptional 5.0% |
| Ukrainians | 96.0 /100 | #93 | Exceptional 5.0% |
| Immigrants | Austria | 95.9 /100 | #94 | Exceptional 5.0% |
| Immigrants | Serbia | 95.6 /100 | #95 | Exceptional 5.0% |
| Immigrants | England | 95.2 /100 | #96 | Exceptional 5.0% |
| Immigrants | Czechoslovakia | 95.1 /100 | #97 | Exceptional 5.0% |
| Romanians | 95.0 /100 | #98 | Exceptional 5.0% |
| Mongolians | 94.8 /100 | #99 | Exceptional 5.0% |
| Estonians | 94.6 /100 | #100 | Exceptional 5.0% |
| Americans | 94.3 /100 | #101 | Exceptional 5.0% |
| Immigrants | Argentina | 94.1 /100 | #102 | Exceptional 5.0% |
| Chickasaw | 94.0 /100 | #103 | Exceptional 5.0% |
| Osage | 94.0 /100 | #104 | Exceptional 5.0% |
| Maltese | 94.0 /100 | #105 | Exceptional 5.0% |