Immigrants from Cambodia vs Zimbabwean Unemployment
COMPARE
Immigrants from Cambodia
Zimbabwean
Unemployment
Unemployment Comparison
Immigrants from Cambodia
Zimbabweans
5.5%
UNEMPLOYMENT
3.3/ 100
METRIC RATING
236th/ 347
METRIC RANK
4.8%
UNEMPLOYMENT
99.8/ 100
METRIC RATING
32nd/ 347
METRIC RANK
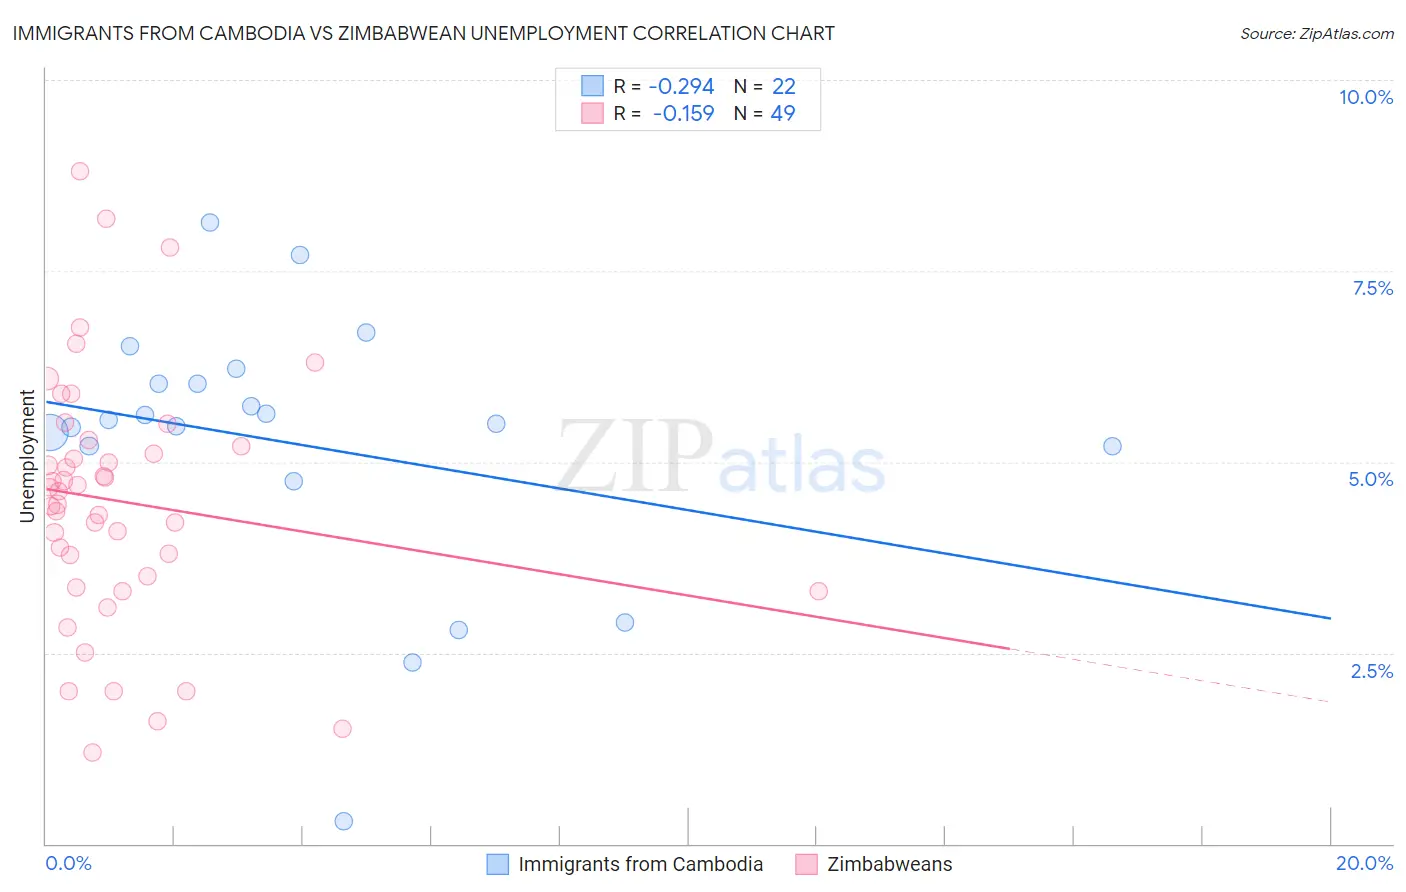
Immigrants from Cambodia vs Zimbabwean Unemployment Correlation Chart
The statistical analysis conducted on geographies consisting of 205,100,731 people shows a weak negative correlation between the proportion of Immigrants from Cambodia and unemployment in the United States with a correlation coefficient (R) of -0.294 and weighted average of 5.5%. Similarly, the statistical analysis conducted on geographies consisting of 69,206,106 people shows a poor negative correlation between the proportion of Zimbabweans and unemployment in the United States with a correlation coefficient (R) of -0.159 and weighted average of 4.8%, a difference of 16.2%.
Unemployment Correlation Summary
| Measurement | Immigrants from Cambodia | Zimbabwean |
| Minimum | 0.30% | 1.2% |
| Maximum | 8.1% | 8.8% |
| Range | 7.8% | 7.6% |
| Mean | 5.2% | 4.5% |
| Median | 5.5% | 4.6% |
| Interquartile 25% (IQ1) | 5.2% | 3.4% |
| Interquartile 75% (IQ3) | 6.0% | 5.2% |
| Interquartile Range (IQR) | 0.83% | 1.8% |
| Standard Deviation (Sample) | 1.8% | 1.6% |
| Standard Deviation (Population) | 1.7% | 1.6% |
Similar Demographics by Unemployment
Demographics Similar to Immigrants from Cambodia by Unemployment
In terms of unemployment, the demographic groups most similar to Immigrants from Cambodia are Immigrants from Panama (5.5%, a difference of 0.030%), Moroccan (5.5%, a difference of 0.060%), Immigrants from Western Asia (5.5%, a difference of 0.27%), Immigrants (5.5%, a difference of 0.36%), and Cree (5.6%, a difference of 0.37%).
| Demographics | Rating | Rank | Unemployment |
| Hawaiians | 5.4 /100 | #229 | Tragic 5.5% |
| Ottawa | 5.4 /100 | #230 | Tragic 5.5% |
| Immigrants | Africa | 4.9 /100 | #231 | Tragic 5.5% |
| Comanche | 4.9 /100 | #232 | Tragic 5.5% |
| Immigrants | Syria | 4.8 /100 | #233 | Tragic 5.5% |
| Panamanians | 4.7 /100 | #234 | Tragic 5.5% |
| Immigrants | Panama | 3.4 /100 | #235 | Tragic 5.5% |
| Immigrants | Cambodia | 3.3 /100 | #236 | Tragic 5.5% |
| Moroccans | 3.2 /100 | #237 | Tragic 5.5% |
| Immigrants | Western Asia | 2.8 /100 | #238 | Tragic 5.5% |
| Immigrants | Immigrants | 2.6 /100 | #239 | Tragic 5.5% |
| Cree | 2.6 /100 | #240 | Tragic 5.6% |
| Tlingit-Haida | 2.0 /100 | #241 | Tragic 5.6% |
| Spanish Americans | 2.0 /100 | #242 | Tragic 5.6% |
| Marshallese | 1.3 /100 | #243 | Tragic 5.6% |
Demographics Similar to Zimbabweans by Unemployment
In terms of unemployment, the demographic groups most similar to Zimbabweans are Sudanese (4.8%, a difference of 0.010%), Immigrants from Bolivia (4.8%, a difference of 0.050%), Croatian (4.8%, a difference of 0.10%), Irish (4.8%, a difference of 0.12%), and Scotch-Irish (4.8%, a difference of 0.12%).
| Demographics | Rating | Rank | Unemployment |
| Latvians | 99.9 /100 | #25 | Exceptional 4.7% |
| Bulgarians | 99.9 /100 | #26 | Exceptional 4.7% |
| Finns | 99.9 /100 | #27 | Exceptional 4.7% |
| Cubans | 99.8 /100 | #28 | Exceptional 4.7% |
| Poles | 99.8 /100 | #29 | Exceptional 4.7% |
| Irish | 99.8 /100 | #30 | Exceptional 4.8% |
| Croatians | 99.8 /100 | #31 | Exceptional 4.8% |
| Zimbabweans | 99.8 /100 | #32 | Exceptional 4.8% |
| Sudanese | 99.8 /100 | #33 | Exceptional 4.8% |
| Immigrants | Bolivia | 99.8 /100 | #34 | Exceptional 4.8% |
| Scotch-Irish | 99.8 /100 | #35 | Exceptional 4.8% |
| Tongans | 99.7 /100 | #36 | Exceptional 4.8% |
| Czechoslovakians | 99.7 /100 | #37 | Exceptional 4.8% |
| Bolivians | 99.7 /100 | #38 | Exceptional 4.8% |
| Lithuanians | 99.7 /100 | #39 | Exceptional 4.8% |