Norwegian vs Tohono O'odham Unemployment
COMPARE
Norwegian
Tohono O'odham
Unemployment
Unemployment Comparison
Norwegians
Tohono O'odham
4.2%
UNEMPLOYMENT
100.0/ 100
METRIC RATING
1st/ 347
METRIC RANK
8.9%
UNEMPLOYMENT
0.0/ 100
METRIC RATING
341st/ 347
METRIC RANK
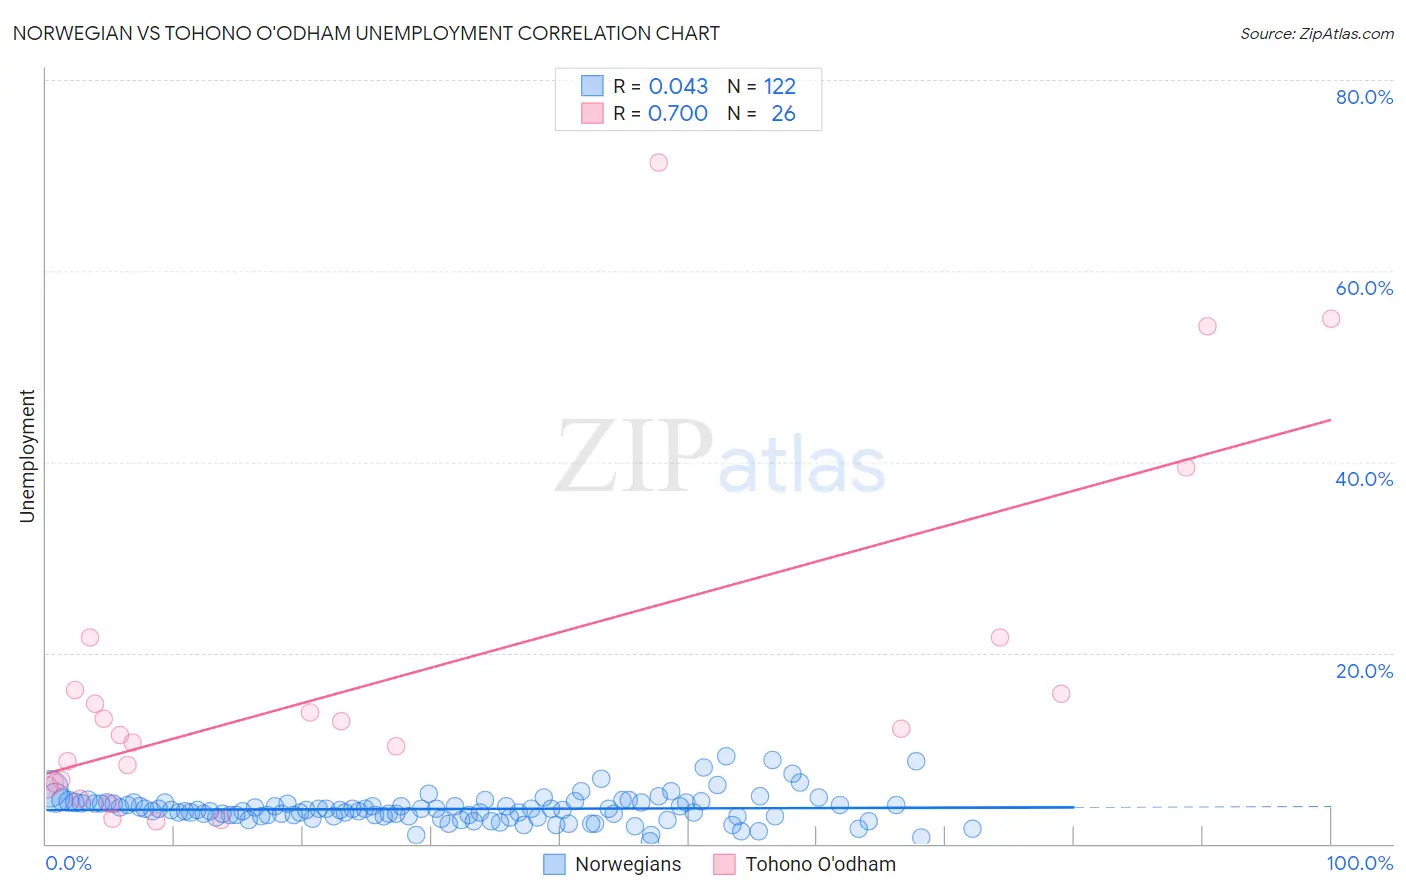
Norwegian vs Tohono O'odham Unemployment Correlation Chart
The statistical analysis conducted on geographies consisting of 530,614,839 people shows no correlation between the proportion of Norwegians and unemployment in the United States with a correlation coefficient (R) of 0.043 and weighted average of 4.2%. Similarly, the statistical analysis conducted on geographies consisting of 58,714,465 people shows a strong positive correlation between the proportion of Tohono O'odham and unemployment in the United States with a correlation coefficient (R) of 0.700 and weighted average of 8.9%, a difference of 111.5%.
Unemployment Correlation Summary
| Measurement | Norwegian | Tohono O'odham |
| Minimum | 0.30% | 2.4% |
| Maximum | 9.2% | 71.4% |
| Range | 8.9% | 69.0% |
| Mean | 3.6% | 17.2% |
| Median | 3.6% | 11.8% |
| Interquartile 25% (IQ1) | 2.9% | 6.4% |
| Interquartile 75% (IQ3) | 4.3% | 16.1% |
| Interquartile Range (IQR) | 1.4% | 9.7% |
| Standard Deviation (Sample) | 1.5% | 17.8% |
| Standard Deviation (Population) | 1.5% | 17.5% |
Similar Demographics by Unemployment
Demographics Similar to Norwegians by Unemployment
In terms of unemployment, the demographic groups most similar to Norwegians are Luxembourger (4.3%, a difference of 3.4%), Czech (4.3%, a difference of 3.5%), Danish (4.3%, a difference of 3.6%), Swedish (4.4%, a difference of 6.0%), and German (4.5%, a difference of 6.9%).
| Demographics | Rating | Rank | Unemployment |
| Norwegians | 100.0 /100 | #1 | Exceptional 4.2% |
| Luxembourgers | 100.0 /100 | #2 | Exceptional 4.3% |
| Czechs | 100.0 /100 | #3 | Exceptional 4.3% |
| Danes | 100.0 /100 | #4 | Exceptional 4.3% |
| Swedes | 100.0 /100 | #5 | Exceptional 4.4% |
| Germans | 100.0 /100 | #6 | Exceptional 4.5% |
| Immigrants | India | 100.0 /100 | #7 | Exceptional 4.5% |
| Swiss | 100.0 /100 | #8 | Exceptional 4.5% |
| Scandinavians | 100.0 /100 | #9 | Exceptional 4.5% |
| Dutch | 100.0 /100 | #10 | Exceptional 4.6% |
| English | 100.0 /100 | #11 | Exceptional 4.6% |
| Pennsylvania Germans | 100.0 /100 | #12 | Exceptional 4.6% |
| Belgians | 100.0 /100 | #13 | Exceptional 4.6% |
| Immigrants | Cuba | 100.0 /100 | #14 | Exceptional 4.6% |
| Europeans | 99.9 /100 | #15 | Exceptional 4.6% |
Demographics Similar to Tohono O'odham by Unemployment
In terms of unemployment, the demographic groups most similar to Tohono O'odham are Hopi (8.9%, a difference of 0.45%), Yuman (9.1%, a difference of 2.1%), Puerto Rican (8.4%, a difference of 5.4%), Navajo (8.4%, a difference of 6.3%), and Pima (8.2%, a difference of 7.9%).
| Demographics | Rating | Rank | Unemployment |
| Immigrants | Dominican Republic | 0.0 /100 | #333 | Tragic 7.4% |
| Apache | 0.0 /100 | #334 | Tragic 7.4% |
| Alaskan Athabascans | 0.0 /100 | #335 | Tragic 7.7% |
| Immigrants | Yemen | 0.0 /100 | #336 | Tragic 7.7% |
| Cheyenne | 0.0 /100 | #337 | Tragic 8.0% |
| Pima | 0.0 /100 | #338 | Tragic 8.2% |
| Navajo | 0.0 /100 | #339 | Tragic 8.4% |
| Puerto Ricans | 0.0 /100 | #340 | Tragic 8.4% |
| Tohono O'odham | 0.0 /100 | #341 | Tragic 8.9% |
| Hopi | 0.0 /100 | #342 | Tragic 8.9% |
| Yuman | 0.0 /100 | #343 | Tragic 9.1% |
| Arapaho | 0.0 /100 | #344 | Tragic 9.8% |
| Inupiat | 0.0 /100 | #345 | Tragic 10.1% |
| Crow | 0.0 /100 | #346 | Tragic 11.1% |
| Yup'ik | 0.0 /100 | #347 | Tragic 13.6% |