Immigrants from Honduras vs Zimbabwean Unemployment
COMPARE
Immigrants from Honduras
Zimbabwean
Unemployment
Unemployment Comparison
Immigrants from Honduras
Zimbabweans
5.7%
UNEMPLOYMENT
0.3/ 100
METRIC RATING
254th/ 347
METRIC RANK
4.8%
UNEMPLOYMENT
99.8/ 100
METRIC RATING
32nd/ 347
METRIC RANK
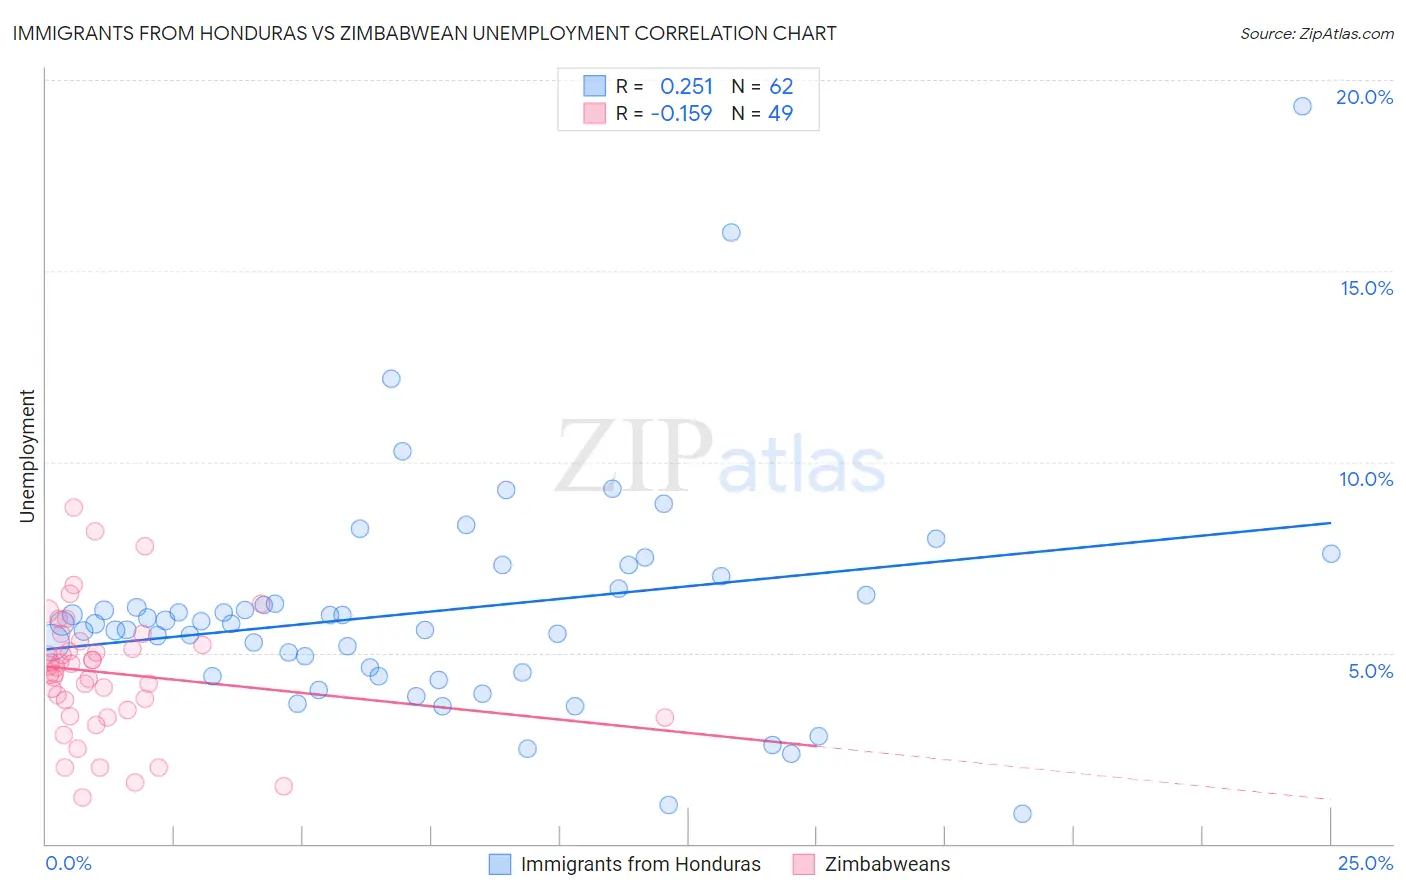
Immigrants from Honduras vs Zimbabwean Unemployment Correlation Chart
The statistical analysis conducted on geographies consisting of 322,382,212 people shows a weak positive correlation between the proportion of Immigrants from Honduras and unemployment in the United States with a correlation coefficient (R) of 0.251 and weighted average of 5.7%. Similarly, the statistical analysis conducted on geographies consisting of 69,206,106 people shows a poor negative correlation between the proportion of Zimbabweans and unemployment in the United States with a correlation coefficient (R) of -0.159 and weighted average of 4.8%, a difference of 20.2%.
Unemployment Correlation Summary
| Measurement | Immigrants from Honduras | Zimbabwean |
| Minimum | 0.80% | 1.2% |
| Maximum | 19.3% | 8.8% |
| Range | 18.5% | 7.6% |
| Mean | 6.1% | 4.5% |
| Median | 5.8% | 4.6% |
| Interquartile 25% (IQ1) | 4.5% | 3.4% |
| Interquartile 75% (IQ3) | 6.7% | 5.2% |
| Interquartile Range (IQR) | 2.2% | 1.8% |
| Standard Deviation (Sample) | 3.0% | 1.6% |
| Standard Deviation (Population) | 2.9% | 1.6% |
Similar Demographics by Unemployment
Demographics Similar to Immigrants from Honduras by Unemployment
In terms of unemployment, the demographic groups most similar to Immigrants from Honduras are Central American (5.7%, a difference of 0.070%), Honduran (5.7%, a difference of 0.080%), Immigrants from Portugal (5.7%, a difference of 0.44%), Guatemalan (5.8%, a difference of 0.65%), and Kiowa (5.7%, a difference of 0.83%).
| Demographics | Rating | Rank | Unemployment |
| Immigrants | Cameroon | 1.0 /100 | #247 | Tragic 5.6% |
| Liberians | 0.9 /100 | #248 | Tragic 5.6% |
| Cajuns | 0.8 /100 | #249 | Tragic 5.6% |
| Japanese | 0.8 /100 | #250 | Tragic 5.6% |
| Kiowa | 0.6 /100 | #251 | Tragic 5.7% |
| Hondurans | 0.3 /100 | #252 | Tragic 5.7% |
| Central Americans | 0.3 /100 | #253 | Tragic 5.7% |
| Immigrants | Honduras | 0.3 /100 | #254 | Tragic 5.7% |
| Immigrants | Portugal | 0.2 /100 | #255 | Tragic 5.7% |
| Guatemalans | 0.2 /100 | #256 | Tragic 5.8% |
| Yaqui | 0.2 /100 | #257 | Tragic 5.8% |
| Immigrants | Bahamas | 0.1 /100 | #258 | Tragic 5.8% |
| Sub-Saharan Africans | 0.1 /100 | #259 | Tragic 5.8% |
| Immigrants | Uzbekistan | 0.1 /100 | #260 | Tragic 5.8% |
| Immigrants | Guatemala | 0.1 /100 | #261 | Tragic 5.8% |
Demographics Similar to Zimbabweans by Unemployment
In terms of unemployment, the demographic groups most similar to Zimbabweans are Sudanese (4.8%, a difference of 0.010%), Immigrants from Bolivia (4.8%, a difference of 0.050%), Croatian (4.8%, a difference of 0.10%), Irish (4.8%, a difference of 0.12%), and Scotch-Irish (4.8%, a difference of 0.12%).
| Demographics | Rating | Rank | Unemployment |
| Latvians | 99.9 /100 | #25 | Exceptional 4.7% |
| Bulgarians | 99.9 /100 | #26 | Exceptional 4.7% |
| Finns | 99.9 /100 | #27 | Exceptional 4.7% |
| Cubans | 99.8 /100 | #28 | Exceptional 4.7% |
| Poles | 99.8 /100 | #29 | Exceptional 4.7% |
| Irish | 99.8 /100 | #30 | Exceptional 4.8% |
| Croatians | 99.8 /100 | #31 | Exceptional 4.8% |
| Zimbabweans | 99.8 /100 | #32 | Exceptional 4.8% |
| Sudanese | 99.8 /100 | #33 | Exceptional 4.8% |
| Immigrants | Bolivia | 99.8 /100 | #34 | Exceptional 4.8% |
| Scotch-Irish | 99.8 /100 | #35 | Exceptional 4.8% |
| Tongans | 99.7 /100 | #36 | Exceptional 4.8% |
| Czechoslovakians | 99.7 /100 | #37 | Exceptional 4.8% |
| Bolivians | 99.7 /100 | #38 | Exceptional 4.8% |
| Lithuanians | 99.7 /100 | #39 | Exceptional 4.8% |