Norwegian vs Carpatho Rusyn Unemployment
COMPARE
Norwegian
Carpatho Rusyn
Unemployment
Unemployment Comparison
Norwegians
Carpatho Rusyns
4.2%
UNEMPLOYMENT
100.0/ 100
METRIC RATING
1st/ 347
METRIC RANK
4.7%
UNEMPLOYMENT
99.9/ 100
METRIC RATING
20th/ 347
METRIC RANK
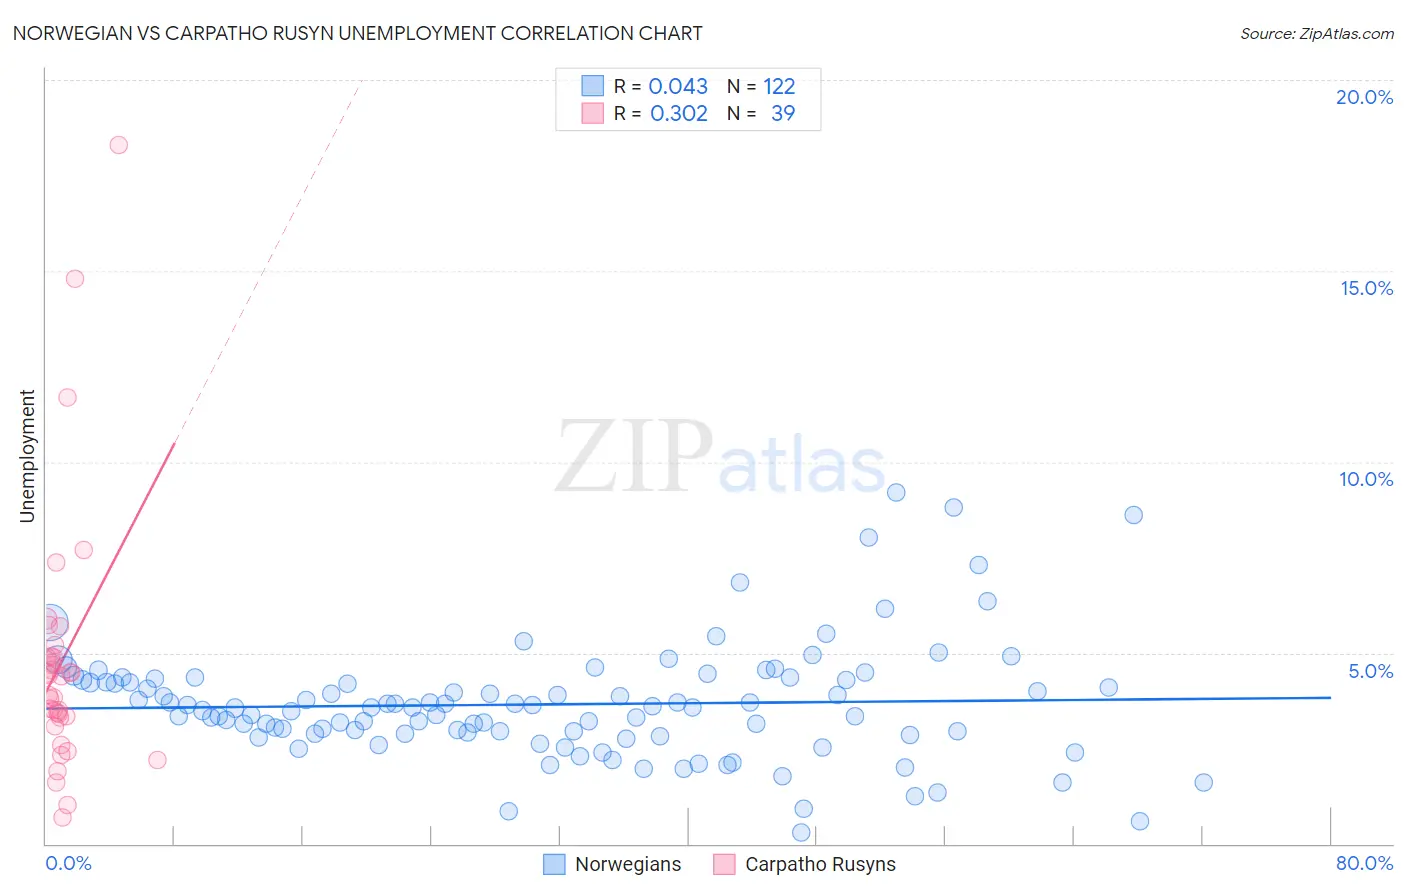
Norwegian vs Carpatho Rusyn Unemployment Correlation Chart
The statistical analysis conducted on geographies consisting of 530,614,839 people shows no correlation between the proportion of Norwegians and unemployment in the United States with a correlation coefficient (R) of 0.043 and weighted average of 4.2%. Similarly, the statistical analysis conducted on geographies consisting of 58,844,361 people shows a mild positive correlation between the proportion of Carpatho Rusyns and unemployment in the United States with a correlation coefficient (R) of 0.302 and weighted average of 4.7%, a difference of 11.8%.
Unemployment Correlation Summary
| Measurement | Norwegian | Carpatho Rusyn |
| Minimum | 0.30% | 0.70% |
| Maximum | 9.2% | 18.3% |
| Range | 8.9% | 17.6% |
| Mean | 3.6% | 4.8% |
| Median | 3.6% | 4.4% |
| Interquartile 25% (IQ1) | 2.9% | 3.3% |
| Interquartile 75% (IQ3) | 4.3% | 4.9% |
| Interquartile Range (IQR) | 1.4% | 1.6% |
| Standard Deviation (Sample) | 1.5% | 3.4% |
| Standard Deviation (Population) | 1.5% | 3.4% |
Demographics Similar to Norwegians and Carpatho Rusyns by Unemployment
In terms of unemployment, the demographic groups most similar to Norwegians are Luxembourger (4.3%, a difference of 3.4%), Czech (4.3%, a difference of 3.5%), Danish (4.3%, a difference of 3.6%), Swedish (4.4%, a difference of 6.0%), and German (4.5%, a difference of 6.9%). Similarly, the demographic groups most similar to Carpatho Rusyns are Scottish (4.7%, a difference of 0.59%), Immigrants from Venezuela (4.7%, a difference of 0.67%), Slovene (4.7%, a difference of 0.69%), Chinese (4.7%, a difference of 0.80%), and European (4.6%, a difference of 0.94%).
| Demographics | Rating | Rank | Unemployment |
| Norwegians | 100.0 /100 | #1 | Exceptional 4.2% |
| Luxembourgers | 100.0 /100 | #2 | Exceptional 4.3% |
| Czechs | 100.0 /100 | #3 | Exceptional 4.3% |
| Danes | 100.0 /100 | #4 | Exceptional 4.3% |
| Swedes | 100.0 /100 | #5 | Exceptional 4.4% |
| Germans | 100.0 /100 | #6 | Exceptional 4.5% |
| Immigrants | India | 100.0 /100 | #7 | Exceptional 4.5% |
| Swiss | 100.0 /100 | #8 | Exceptional 4.5% |
| Scandinavians | 100.0 /100 | #9 | Exceptional 4.5% |
| Dutch | 100.0 /100 | #10 | Exceptional 4.6% |
| English | 100.0 /100 | #11 | Exceptional 4.6% |
| Pennsylvania Germans | 100.0 /100 | #12 | Exceptional 4.6% |
| Belgians | 100.0 /100 | #13 | Exceptional 4.6% |
| Immigrants | Cuba | 100.0 /100 | #14 | Exceptional 4.6% |
| Europeans | 99.9 /100 | #15 | Exceptional 4.6% |
| Chinese | 99.9 /100 | #16 | Exceptional 4.7% |
| Slovenes | 99.9 /100 | #17 | Exceptional 4.7% |
| Immigrants | Venezuela | 99.9 /100 | #18 | Exceptional 4.7% |
| Scottish | 99.9 /100 | #19 | Exceptional 4.7% |
| Carpatho Rusyns | 99.9 /100 | #20 | Exceptional 4.7% |