Mexican vs Yakama Unemployment
COMPARE
Mexican
Yakama
Unemployment
Unemployment Comparison
Mexicans
Yakama
5.9%
UNEMPLOYMENT
0.1/ 100
METRIC RATING
271st/ 347
METRIC RANK
7.3%
UNEMPLOYMENT
0.0/ 100
METRIC RATING
330th/ 347
METRIC RANK
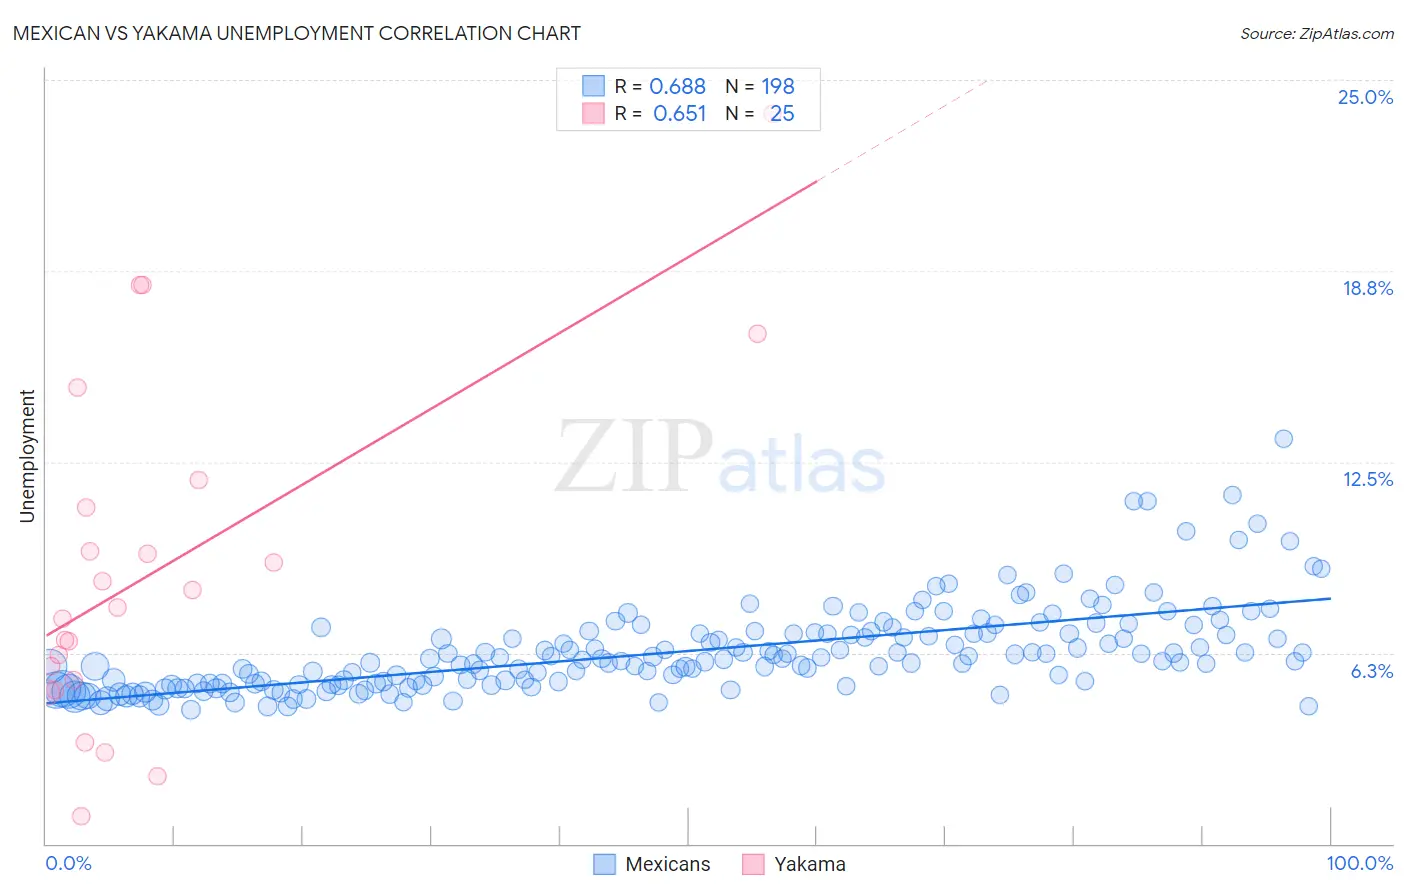
Mexican vs Yakama Unemployment Correlation Chart
The statistical analysis conducted on geographies consisting of 561,800,236 people shows a significant positive correlation between the proportion of Mexicans and unemployment in the United States with a correlation coefficient (R) of 0.688 and weighted average of 5.9%. Similarly, the statistical analysis conducted on geographies consisting of 19,909,925 people shows a significant positive correlation between the proportion of Yakama and unemployment in the United States with a correlation coefficient (R) of 0.651 and weighted average of 7.3%, a difference of 25.2%.
Unemployment Correlation Summary
| Measurement | Mexican | Yakama |
| Minimum | 4.4% | 0.90% |
| Maximum | 13.3% | 23.9% |
| Range | 8.9% | 23.0% |
| Mean | 6.3% | 9.0% |
| Median | 6.0% | 7.7% |
| Interquartile 25% (IQ1) | 5.2% | 5.2% |
| Interquartile 75% (IQ3) | 6.9% | 11.5% |
| Interquartile Range (IQR) | 1.7% | 6.3% |
| Standard Deviation (Sample) | 1.4% | 5.6% |
| Standard Deviation (Population) | 1.4% | 5.5% |
Similar Demographics by Unemployment
Demographics Similar to Mexicans by Unemployment
In terms of unemployment, the demographic groups most similar to Mexicans are Blackfeet (5.8%, a difference of 0.23%), Immigrants from El Salvador (5.8%, a difference of 0.31%), Immigrants from Sierra Leone (5.8%, a difference of 0.32%), Immigrants from Nigeria (5.8%, a difference of 0.36%), and Mexican American Indian (5.8%, a difference of 0.43%).
| Demographics | Rating | Rank | Unemployment |
| Immigrants | Liberia | 0.1 /100 | #264 | Tragic 5.8% |
| Nigerians | 0.1 /100 | #265 | Tragic 5.8% |
| Mexican American Indians | 0.1 /100 | #266 | Tragic 5.8% |
| Immigrants | Nigeria | 0.1 /100 | #267 | Tragic 5.8% |
| Immigrants | Sierra Leone | 0.1 /100 | #268 | Tragic 5.8% |
| Immigrants | El Salvador | 0.1 /100 | #269 | Tragic 5.8% |
| Blackfeet | 0.1 /100 | #270 | Tragic 5.8% |
| Mexicans | 0.1 /100 | #271 | Tragic 5.9% |
| Hispanics or Latinos | 0.0 /100 | #272 | Tragic 5.9% |
| Immigrants | Fiji | 0.0 /100 | #273 | Tragic 5.9% |
| Bahamians | 0.0 /100 | #274 | Tragic 5.9% |
| Immigrants | Latin America | 0.0 /100 | #275 | Tragic 5.9% |
| Immigrants | Central America | 0.0 /100 | #276 | Tragic 6.0% |
| Armenians | 0.0 /100 | #277 | Tragic 6.0% |
| Ghanaians | 0.0 /100 | #278 | Tragic 6.0% |
Demographics Similar to Yakama by Unemployment
In terms of unemployment, the demographic groups most similar to Yakama are Dominican (7.4%, a difference of 0.33%), Sioux (7.4%, a difference of 0.76%), Immigrants from Dominican Republic (7.4%, a difference of 0.82%), Alaska Native (7.2%, a difference of 1.3%), and Apache (7.4%, a difference of 1.3%).
| Demographics | Rating | Rank | Unemployment |
| Immigrants | Grenada | 0.0 /100 | #323 | Tragic 6.9% |
| Immigrants | Armenia | 0.0 /100 | #324 | Tragic 7.0% |
| Natives/Alaskans | 0.0 /100 | #325 | Tragic 7.0% |
| Paiute | 0.0 /100 | #326 | Tragic 7.1% |
| Pueblo | 0.0 /100 | #327 | Tragic 7.2% |
| Tsimshian | 0.0 /100 | #328 | Tragic 7.2% |
| Alaska Natives | 0.0 /100 | #329 | Tragic 7.2% |
| Yakama | 0.0 /100 | #330 | Tragic 7.3% |
| Dominicans | 0.0 /100 | #331 | Tragic 7.4% |
| Sioux | 0.0 /100 | #332 | Tragic 7.4% |
| Immigrants | Dominican Republic | 0.0 /100 | #333 | Tragic 7.4% |
| Apache | 0.0 /100 | #334 | Tragic 7.4% |
| Alaskan Athabascans | 0.0 /100 | #335 | Tragic 7.7% |
| Immigrants | Yemen | 0.0 /100 | #336 | Tragic 7.7% |
| Cheyenne | 0.0 /100 | #337 | Tragic 8.0% |