Immigrants from Haiti vs Yakama Unemployment
COMPARE
Immigrants from Haiti
Yakama
Unemployment
Unemployment Comparison
Immigrants from Haiti
Yakama
6.3%
UNEMPLOYMENT
0.0/ 100
METRIC RATING
298th/ 347
METRIC RANK
7.3%
UNEMPLOYMENT
0.0/ 100
METRIC RATING
330th/ 347
METRIC RANK
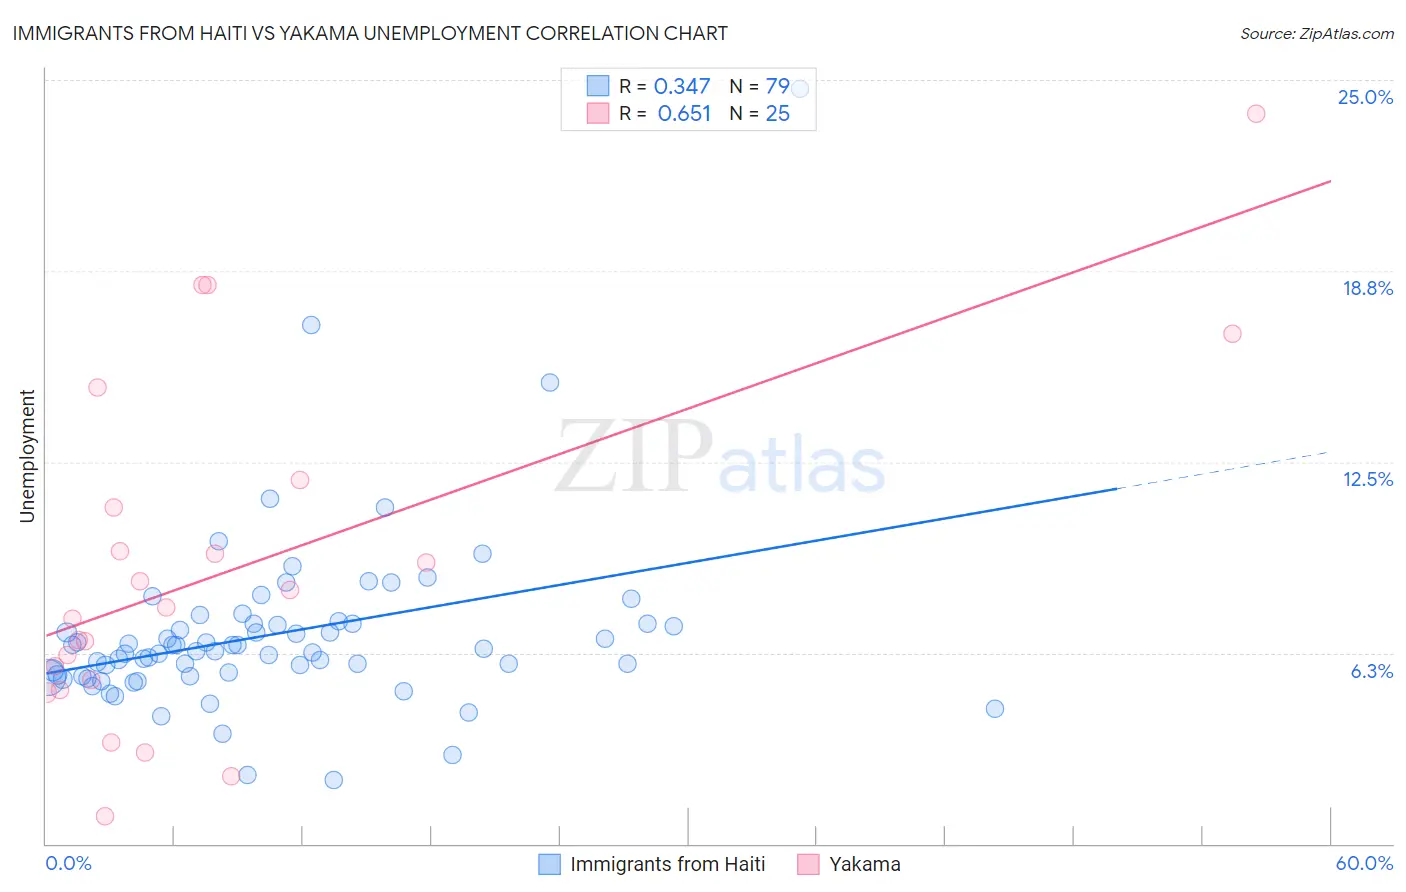
Immigrants from Haiti vs Yakama Unemployment Correlation Chart
The statistical analysis conducted on geographies consisting of 225,163,830 people shows a mild positive correlation between the proportion of Immigrants from Haiti and unemployment in the United States with a correlation coefficient (R) of 0.347 and weighted average of 6.3%. Similarly, the statistical analysis conducted on geographies consisting of 19,909,925 people shows a significant positive correlation between the proportion of Yakama and unemployment in the United States with a correlation coefficient (R) of 0.651 and weighted average of 7.3%, a difference of 16.3%.
Unemployment Correlation Summary
| Measurement | Immigrants from Haiti | Yakama |
| Minimum | 2.1% | 0.90% |
| Maximum | 24.7% | 23.9% |
| Range | 22.6% | 23.0% |
| Mean | 6.9% | 9.0% |
| Median | 6.3% | 7.7% |
| Interquartile 25% (IQ1) | 5.5% | 5.2% |
| Interquartile 75% (IQ3) | 7.2% | 11.5% |
| Interquartile Range (IQR) | 1.7% | 6.3% |
| Standard Deviation (Sample) | 3.0% | 5.6% |
| Standard Deviation (Population) | 3.0% | 5.5% |
Similar Demographics by Unemployment
Demographics Similar to Immigrants from Haiti by Unemployment
In terms of unemployment, the demographic groups most similar to Immigrants from Haiti are Immigrants from West Indies (6.3%, a difference of 0.050%), Jamaican (6.3%, a difference of 0.090%), Immigrants from Trinidad and Tobago (6.3%, a difference of 0.17%), Ute (6.3%, a difference of 0.43%), and Trinidadian and Tobagonian (6.3%, a difference of 0.65%).
| Demographics | Rating | Rank | Unemployment |
| Haitians | 0.0 /100 | #291 | Tragic 6.2% |
| Central American Indians | 0.0 /100 | #292 | Tragic 6.2% |
| Immigrants | Ecuador | 0.0 /100 | #293 | Tragic 6.2% |
| Spanish American Indians | 0.0 /100 | #294 | Tragic 6.2% |
| U.S. Virgin Islanders | 0.0 /100 | #295 | Tragic 6.3% |
| Ute | 0.0 /100 | #296 | Tragic 6.3% |
| Jamaicans | 0.0 /100 | #297 | Tragic 6.3% |
| Immigrants | Haiti | 0.0 /100 | #298 | Tragic 6.3% |
| Immigrants | West Indies | 0.0 /100 | #299 | Tragic 6.3% |
| Immigrants | Trinidad and Tobago | 0.0 /100 | #300 | Tragic 6.3% |
| Trinidadians and Tobagonians | 0.0 /100 | #301 | Tragic 6.3% |
| West Indians | 0.0 /100 | #302 | Tragic 6.4% |
| Belizeans | 0.0 /100 | #303 | Tragic 6.4% |
| Immigrants | Jamaica | 0.0 /100 | #304 | Tragic 6.4% |
| Menominee | 0.0 /100 | #305 | Tragic 6.4% |
Demographics Similar to Yakama by Unemployment
In terms of unemployment, the demographic groups most similar to Yakama are Dominican (7.4%, a difference of 0.33%), Sioux (7.4%, a difference of 0.76%), Immigrants from Dominican Republic (7.4%, a difference of 0.82%), Alaska Native (7.2%, a difference of 1.3%), and Apache (7.4%, a difference of 1.3%).
| Demographics | Rating | Rank | Unemployment |
| Immigrants | Grenada | 0.0 /100 | #323 | Tragic 6.9% |
| Immigrants | Armenia | 0.0 /100 | #324 | Tragic 7.0% |
| Natives/Alaskans | 0.0 /100 | #325 | Tragic 7.0% |
| Paiute | 0.0 /100 | #326 | Tragic 7.1% |
| Pueblo | 0.0 /100 | #327 | Tragic 7.2% |
| Tsimshian | 0.0 /100 | #328 | Tragic 7.2% |
| Alaska Natives | 0.0 /100 | #329 | Tragic 7.2% |
| Yakama | 0.0 /100 | #330 | Tragic 7.3% |
| Dominicans | 0.0 /100 | #331 | Tragic 7.4% |
| Sioux | 0.0 /100 | #332 | Tragic 7.4% |
| Immigrants | Dominican Republic | 0.0 /100 | #333 | Tragic 7.4% |
| Apache | 0.0 /100 | #334 | Tragic 7.4% |
| Alaskan Athabascans | 0.0 /100 | #335 | Tragic 7.7% |
| Immigrants | Yemen | 0.0 /100 | #336 | Tragic 7.7% |
| Cheyenne | 0.0 /100 | #337 | Tragic 8.0% |