Immigrants from Cameroon vs Yakama Unemployment
COMPARE
Immigrants from Cameroon
Yakama
Unemployment
Unemployment Comparison
Immigrants from Cameroon
Yakama
5.6%
UNEMPLOYMENT
1.0/ 100
METRIC RATING
247th/ 347
METRIC RANK
7.3%
UNEMPLOYMENT
0.0/ 100
METRIC RATING
330th/ 347
METRIC RANK
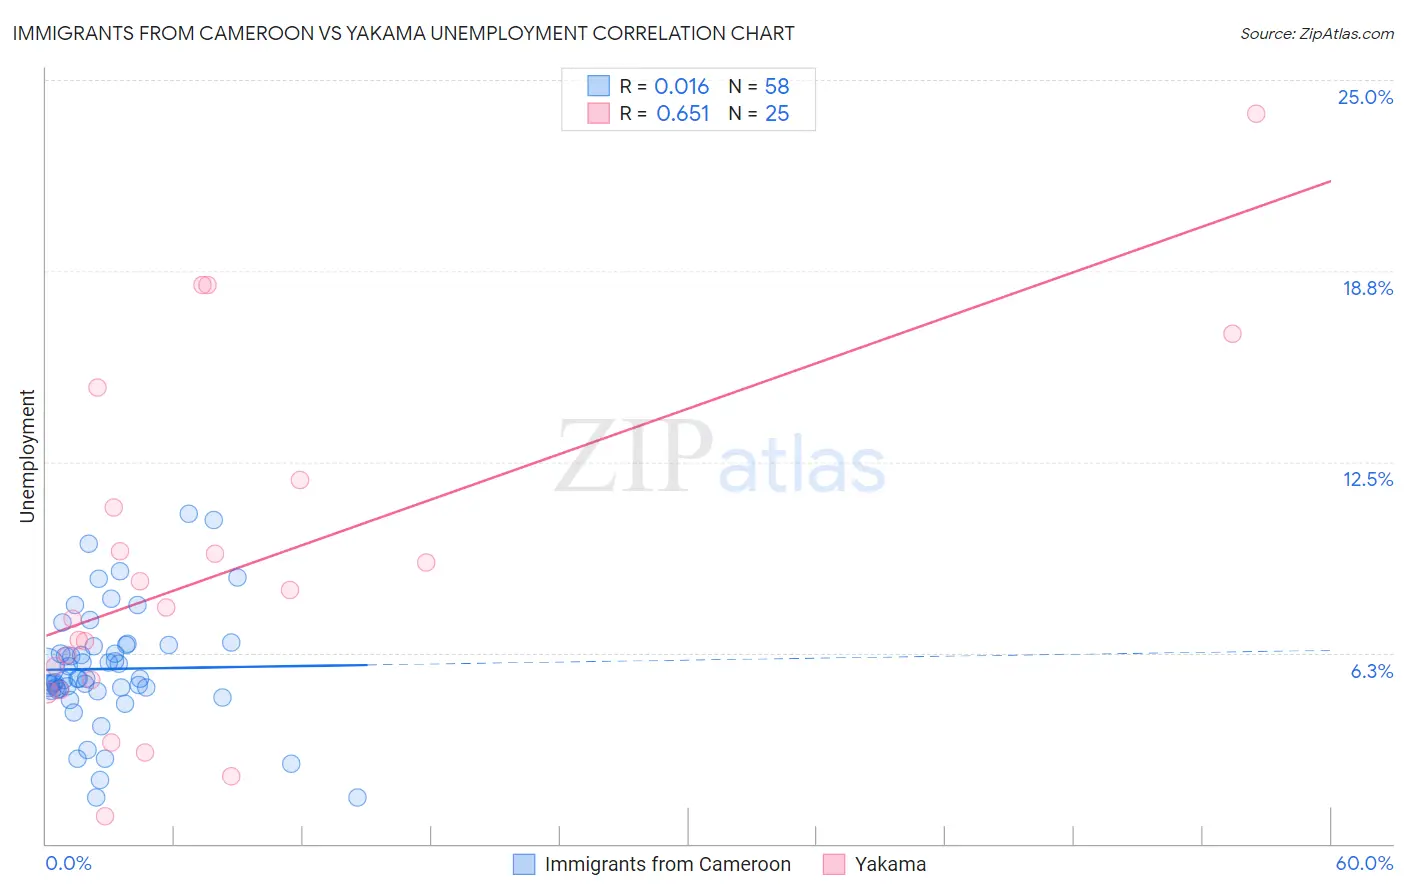
Immigrants from Cameroon vs Yakama Unemployment Correlation Chart
The statistical analysis conducted on geographies consisting of 130,734,727 people shows no correlation between the proportion of Immigrants from Cameroon and unemployment in the United States with a correlation coefficient (R) of 0.016 and weighted average of 5.6%. Similarly, the statistical analysis conducted on geographies consisting of 19,909,925 people shows a significant positive correlation between the proportion of Yakama and unemployment in the United States with a correlation coefficient (R) of 0.651 and weighted average of 7.3%, a difference of 30.3%.
Unemployment Correlation Summary
| Measurement | Immigrants from Cameroon | Yakama |
| Minimum | 1.5% | 0.90% |
| Maximum | 10.8% | 23.9% |
| Range | 9.3% | 23.0% |
| Mean | 5.7% | 9.0% |
| Median | 5.4% | 7.7% |
| Interquartile 25% (IQ1) | 5.1% | 5.2% |
| Interquartile 75% (IQ3) | 6.5% | 11.5% |
| Interquartile Range (IQR) | 1.4% | 6.3% |
| Standard Deviation (Sample) | 1.9% | 5.6% |
| Standard Deviation (Population) | 1.9% | 5.5% |
Similar Demographics by Unemployment
Demographics Similar to Immigrants from Cameroon by Unemployment
In terms of unemployment, the demographic groups most similar to Immigrants from Cameroon are Liberian (5.6%, a difference of 0.13%), Bermudan (5.6%, a difference of 0.15%), French American Indian (5.6%, a difference of 0.19%), Dutch West Indian (5.6%, a difference of 0.21%), and Marshallese (5.6%, a difference of 0.36%).
| Demographics | Rating | Rank | Unemployment |
| Cree | 2.6 /100 | #240 | Tragic 5.6% |
| Tlingit-Haida | 2.0 /100 | #241 | Tragic 5.6% |
| Spanish Americans | 2.0 /100 | #242 | Tragic 5.6% |
| Marshallese | 1.3 /100 | #243 | Tragic 5.6% |
| Dutch West Indians | 1.2 /100 | #244 | Tragic 5.6% |
| French American Indians | 1.2 /100 | #245 | Tragic 5.6% |
| Bermudans | 1.1 /100 | #246 | Tragic 5.6% |
| Immigrants | Cameroon | 1.0 /100 | #247 | Tragic 5.6% |
| Liberians | 0.9 /100 | #248 | Tragic 5.6% |
| Cajuns | 0.8 /100 | #249 | Tragic 5.6% |
| Japanese | 0.8 /100 | #250 | Tragic 5.6% |
| Kiowa | 0.6 /100 | #251 | Tragic 5.7% |
| Hondurans | 0.3 /100 | #252 | Tragic 5.7% |
| Central Americans | 0.3 /100 | #253 | Tragic 5.7% |
| Immigrants | Honduras | 0.3 /100 | #254 | Tragic 5.7% |
Demographics Similar to Yakama by Unemployment
In terms of unemployment, the demographic groups most similar to Yakama are Dominican (7.4%, a difference of 0.33%), Sioux (7.4%, a difference of 0.76%), Immigrants from Dominican Republic (7.4%, a difference of 0.82%), Alaska Native (7.2%, a difference of 1.3%), and Apache (7.4%, a difference of 1.3%).
| Demographics | Rating | Rank | Unemployment |
| Immigrants | Grenada | 0.0 /100 | #323 | Tragic 6.9% |
| Immigrants | Armenia | 0.0 /100 | #324 | Tragic 7.0% |
| Natives/Alaskans | 0.0 /100 | #325 | Tragic 7.0% |
| Paiute | 0.0 /100 | #326 | Tragic 7.1% |
| Pueblo | 0.0 /100 | #327 | Tragic 7.2% |
| Tsimshian | 0.0 /100 | #328 | Tragic 7.2% |
| Alaska Natives | 0.0 /100 | #329 | Tragic 7.2% |
| Yakama | 0.0 /100 | #330 | Tragic 7.3% |
| Dominicans | 0.0 /100 | #331 | Tragic 7.4% |
| Sioux | 0.0 /100 | #332 | Tragic 7.4% |
| Immigrants | Dominican Republic | 0.0 /100 | #333 | Tragic 7.4% |
| Apache | 0.0 /100 | #334 | Tragic 7.4% |
| Alaskan Athabascans | 0.0 /100 | #335 | Tragic 7.7% |
| Immigrants | Yemen | 0.0 /100 | #336 | Tragic 7.7% |
| Cheyenne | 0.0 /100 | #337 | Tragic 8.0% |