Immigrants from China vs Tohono O'odham Unemployment
COMPARE
Immigrants from China
Tohono O'odham
Unemployment
Unemployment Comparison
Immigrants from China
Tohono O'odham
5.2%
UNEMPLOYMENT
74.7/ 100
METRIC RATING
154th/ 347
METRIC RANK
8.9%
UNEMPLOYMENT
0.0/ 100
METRIC RATING
341st/ 347
METRIC RANK
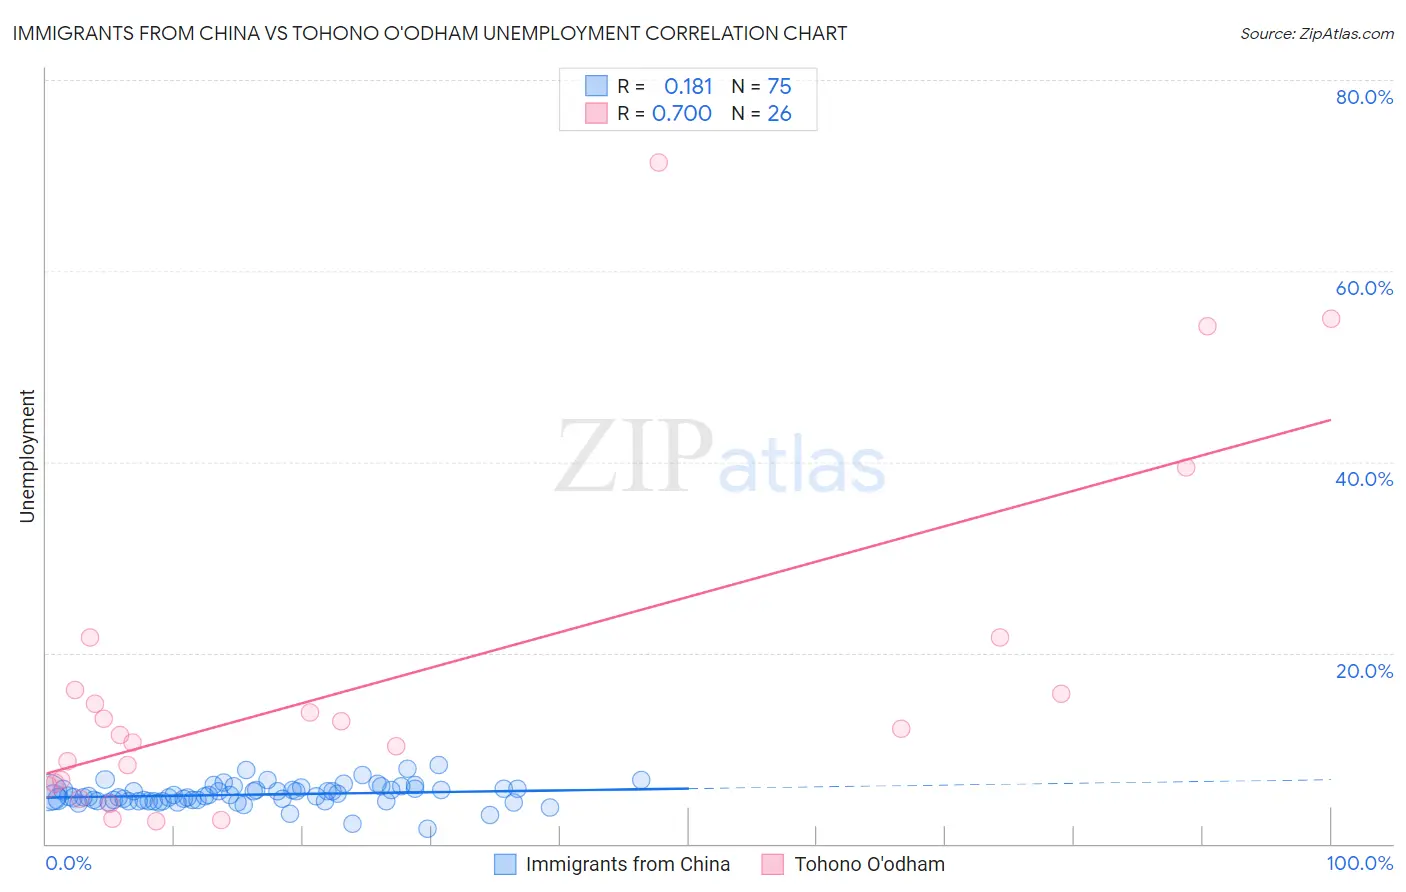
Immigrants from China vs Tohono O'odham Unemployment Correlation Chart
The statistical analysis conducted on geographies consisting of 456,493,067 people shows a poor positive correlation between the proportion of Immigrants from China and unemployment in the United States with a correlation coefficient (R) of 0.181 and weighted average of 5.2%. Similarly, the statistical analysis conducted on geographies consisting of 58,714,465 people shows a strong positive correlation between the proportion of Tohono O'odham and unemployment in the United States with a correlation coefficient (R) of 0.700 and weighted average of 8.9%, a difference of 71.7%.
Unemployment Correlation Summary
| Measurement | Immigrants from China | Tohono O'odham |
| Minimum | 1.6% | 2.4% |
| Maximum | 8.2% | 71.4% |
| Range | 6.6% | 69.0% |
| Mean | 5.1% | 17.2% |
| Median | 5.0% | 11.8% |
| Interquartile 25% (IQ1) | 4.5% | 6.4% |
| Interquartile 75% (IQ3) | 5.7% | 16.1% |
| Interquartile Range (IQR) | 1.2% | 9.7% |
| Standard Deviation (Sample) | 1.1% | 17.8% |
| Standard Deviation (Population) | 1.1% | 17.5% |
Similar Demographics by Unemployment
Demographics Similar to Immigrants from China by Unemployment
In terms of unemployment, the demographic groups most similar to Immigrants from China are Immigrants from Hong Kong (5.2%, a difference of 0.040%), Egyptian (5.2%, a difference of 0.040%), Immigrants from Eastern Europe (5.2%, a difference of 0.050%), Potawatomi (5.2%, a difference of 0.12%), and Syrian (5.2%, a difference of 0.26%).
| Demographics | Rating | Rank | Unemployment |
| Indians (Asian) | 81.6 /100 | #147 | Excellent 5.1% |
| Immigrants | Italy | 79.1 /100 | #148 | Good 5.1% |
| Syrians | 77.7 /100 | #149 | Good 5.2% |
| Potawatomi | 76.2 /100 | #150 | Good 5.2% |
| Immigrants | Eastern Europe | 75.3 /100 | #151 | Good 5.2% |
| Immigrants | Hong Kong | 75.2 /100 | #152 | Good 5.2% |
| Egyptians | 75.2 /100 | #153 | Good 5.2% |
| Immigrants | China | 74.7 /100 | #154 | Good 5.2% |
| Immigrants | Northern Africa | 71.3 /100 | #155 | Good 5.2% |
| Immigrants | Kazakhstan | 70.4 /100 | #156 | Good 5.2% |
| Sri Lankans | 69.5 /100 | #157 | Good 5.2% |
| Immigrants | Egypt | 66.7 /100 | #158 | Good 5.2% |
| Immigrants | Russia | 66.6 /100 | #159 | Good 5.2% |
| Laotians | 66.3 /100 | #160 | Good 5.2% |
| Immigrants | Oceania | 65.2 /100 | #161 | Good 5.2% |
Demographics Similar to Tohono O'odham by Unemployment
In terms of unemployment, the demographic groups most similar to Tohono O'odham are Hopi (8.9%, a difference of 0.45%), Yuman (9.1%, a difference of 2.1%), Puerto Rican (8.4%, a difference of 5.4%), Navajo (8.4%, a difference of 6.3%), and Pima (8.2%, a difference of 7.9%).
| Demographics | Rating | Rank | Unemployment |
| Immigrants | Dominican Republic | 0.0 /100 | #333 | Tragic 7.4% |
| Apache | 0.0 /100 | #334 | Tragic 7.4% |
| Alaskan Athabascans | 0.0 /100 | #335 | Tragic 7.7% |
| Immigrants | Yemen | 0.0 /100 | #336 | Tragic 7.7% |
| Cheyenne | 0.0 /100 | #337 | Tragic 8.0% |
| Pima | 0.0 /100 | #338 | Tragic 8.2% |
| Navajo | 0.0 /100 | #339 | Tragic 8.4% |
| Puerto Ricans | 0.0 /100 | #340 | Tragic 8.4% |
| Tohono O'odham | 0.0 /100 | #341 | Tragic 8.9% |
| Hopi | 0.0 /100 | #342 | Tragic 8.9% |
| Yuman | 0.0 /100 | #343 | Tragic 9.1% |
| Arapaho | 0.0 /100 | #344 | Tragic 9.8% |
| Inupiat | 0.0 /100 | #345 | Tragic 10.1% |
| Crow | 0.0 /100 | #346 | Tragic 11.1% |
| Yup'ik | 0.0 /100 | #347 | Tragic 13.6% |