Dominican vs Tohono O'odham Unemployment
COMPARE
Dominican
Tohono O'odham
Unemployment
Unemployment Comparison
Dominicans
Tohono O'odham
7.4%
UNEMPLOYMENT
0.0/ 100
METRIC RATING
331st/ 347
METRIC RANK
8.9%
UNEMPLOYMENT
0.0/ 100
METRIC RATING
341st/ 347
METRIC RANK
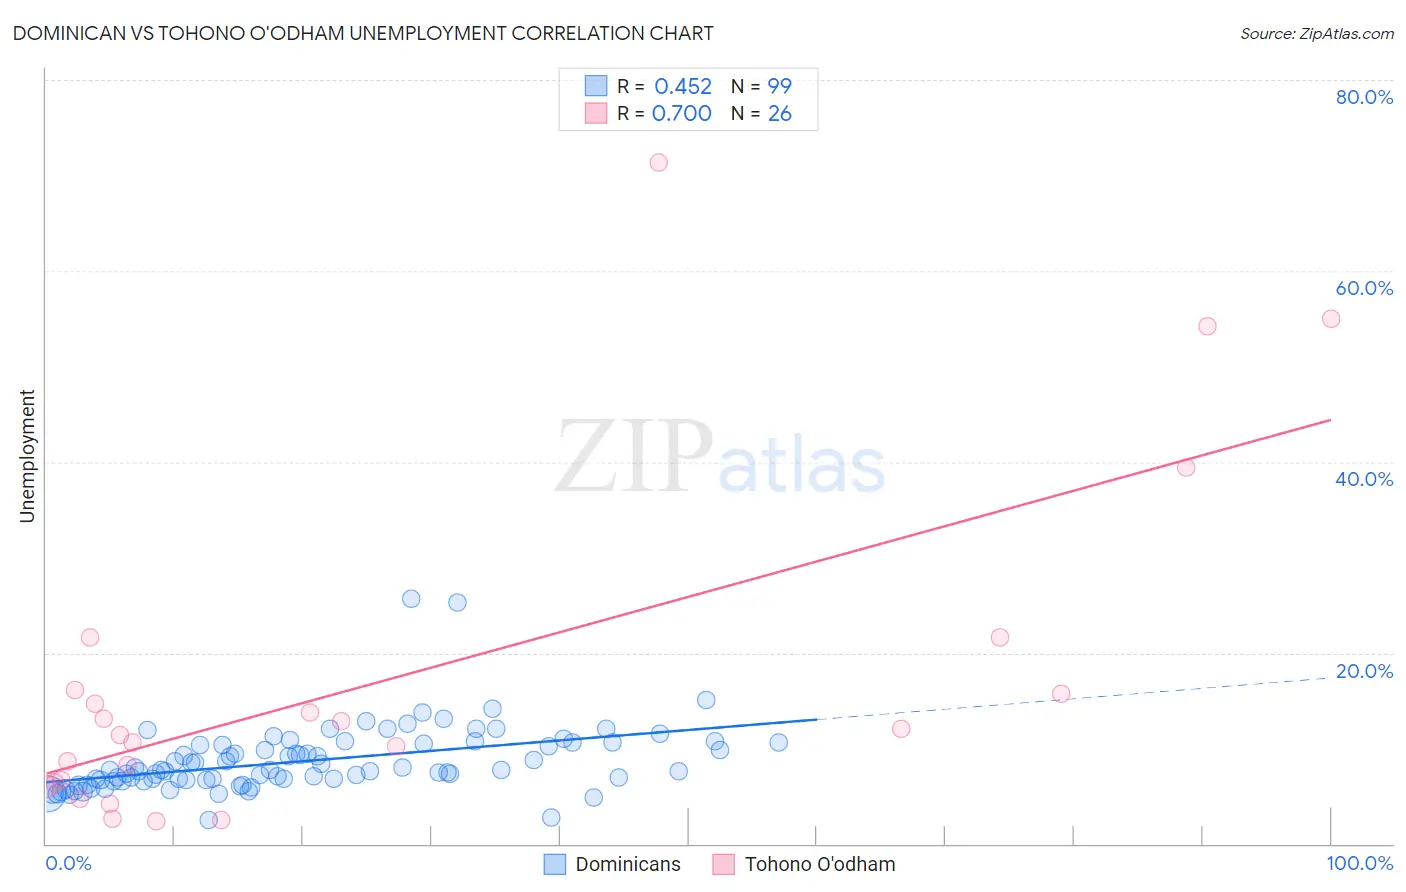
Dominican vs Tohono O'odham Unemployment Correlation Chart
The statistical analysis conducted on geographies consisting of 354,741,881 people shows a moderate positive correlation between the proportion of Dominicans and unemployment in the United States with a correlation coefficient (R) of 0.452 and weighted average of 7.4%. Similarly, the statistical analysis conducted on geographies consisting of 58,714,465 people shows a strong positive correlation between the proportion of Tohono O'odham and unemployment in the United States with a correlation coefficient (R) of 0.700 and weighted average of 8.9%, a difference of 20.6%.
Unemployment Correlation Summary
| Measurement | Dominican | Tohono O'odham |
| Minimum | 2.5% | 2.4% |
| Maximum | 25.6% | 71.4% |
| Range | 23.1% | 69.0% |
| Mean | 8.6% | 17.2% |
| Median | 7.7% | 11.8% |
| Interquartile 25% (IQ1) | 6.6% | 6.4% |
| Interquartile 75% (IQ3) | 10.4% | 16.1% |
| Interquartile Range (IQR) | 3.8% | 9.7% |
| Standard Deviation (Sample) | 3.5% | 17.8% |
| Standard Deviation (Population) | 3.5% | 17.5% |
Demographics Similar to Dominicans and Tohono O'odham by Unemployment
In terms of unemployment, the demographic groups most similar to Dominicans are Yakama (7.3%, a difference of 0.33%), Sioux (7.4%, a difference of 0.42%), Immigrants from Dominican Republic (7.4%, a difference of 0.48%), Apache (7.4%, a difference of 0.95%), and Alaska Native (7.2%, a difference of 1.6%). Similarly, the demographic groups most similar to Tohono O'odham are Hopi (8.9%, a difference of 0.45%), Yuman (9.1%, a difference of 2.1%), Puerto Rican (8.4%, a difference of 5.4%), Navajo (8.4%, a difference of 6.3%), and Pima (8.2%, a difference of 7.9%).
| Demographics | Rating | Rank | Unemployment |
| Paiute | 0.0 /100 | #326 | Tragic 7.1% |
| Pueblo | 0.0 /100 | #327 | Tragic 7.2% |
| Tsimshian | 0.0 /100 | #328 | Tragic 7.2% |
| Alaska Natives | 0.0 /100 | #329 | Tragic 7.2% |
| Yakama | 0.0 /100 | #330 | Tragic 7.3% |
| Dominicans | 0.0 /100 | #331 | Tragic 7.4% |
| Sioux | 0.0 /100 | #332 | Tragic 7.4% |
| Immigrants | Dominican Republic | 0.0 /100 | #333 | Tragic 7.4% |
| Apache | 0.0 /100 | #334 | Tragic 7.4% |
| Alaskan Athabascans | 0.0 /100 | #335 | Tragic 7.7% |
| Immigrants | Yemen | 0.0 /100 | #336 | Tragic 7.7% |
| Cheyenne | 0.0 /100 | #337 | Tragic 8.0% |
| Pima | 0.0 /100 | #338 | Tragic 8.2% |
| Navajo | 0.0 /100 | #339 | Tragic 8.4% |
| Puerto Ricans | 0.0 /100 | #340 | Tragic 8.4% |
| Tohono O'odham | 0.0 /100 | #341 | Tragic 8.9% |
| Hopi | 0.0 /100 | #342 | Tragic 8.9% |
| Yuman | 0.0 /100 | #343 | Tragic 9.1% |
| Arapaho | 0.0 /100 | #344 | Tragic 9.8% |
| Inupiat | 0.0 /100 | #345 | Tragic 10.1% |
| Crow | 0.0 /100 | #346 | Tragic 11.1% |