Immigrants from Scotland vs Tohono O'odham Unemployment
COMPARE
Immigrants from Scotland
Tohono O'odham
Unemployment
Unemployment Comparison
Immigrants from Scotland
Tohono O'odham
4.9%
UNEMPLOYMENT
99.3/ 100
METRIC RATING
48th/ 347
METRIC RANK
8.9%
UNEMPLOYMENT
0.0/ 100
METRIC RATING
341st/ 347
METRIC RANK
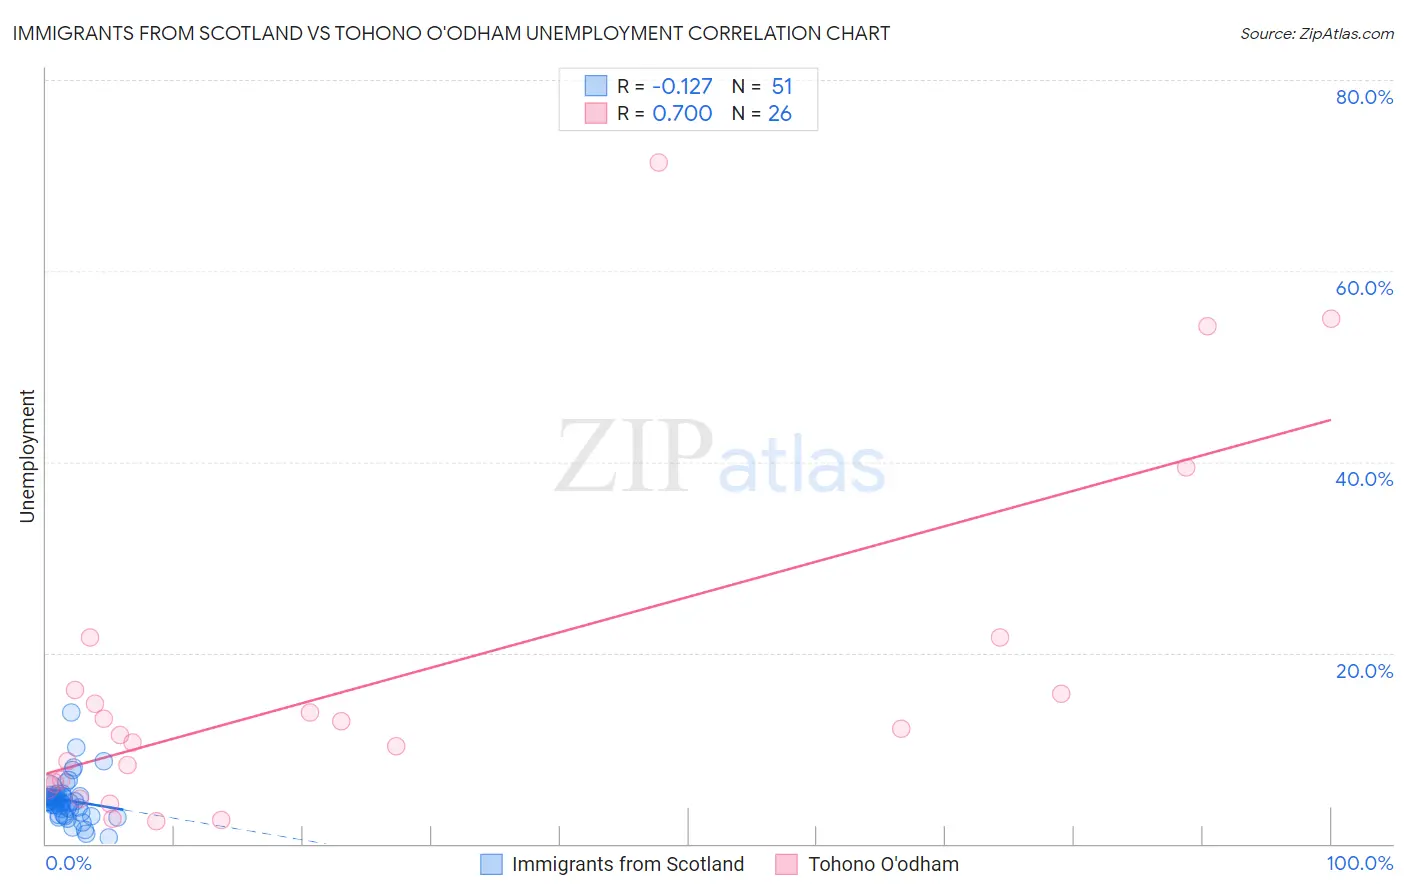
Immigrants from Scotland vs Tohono O'odham Unemployment Correlation Chart
The statistical analysis conducted on geographies consisting of 196,312,940 people shows a poor negative correlation between the proportion of Immigrants from Scotland and unemployment in the United States with a correlation coefficient (R) of -0.127 and weighted average of 4.9%. Similarly, the statistical analysis conducted on geographies consisting of 58,714,465 people shows a strong positive correlation between the proportion of Tohono O'odham and unemployment in the United States with a correlation coefficient (R) of 0.700 and weighted average of 8.9%, a difference of 82.7%.
Unemployment Correlation Summary
| Measurement | Immigrants from Scotland | Tohono O'odham |
| Minimum | 0.60% | 2.4% |
| Maximum | 13.8% | 71.4% |
| Range | 13.2% | 69.0% |
| Mean | 4.6% | 17.2% |
| Median | 4.5% | 11.8% |
| Interquartile 25% (IQ1) | 3.3% | 6.4% |
| Interquartile 75% (IQ3) | 5.0% | 16.1% |
| Interquartile Range (IQR) | 1.7% | 9.7% |
| Standard Deviation (Sample) | 2.2% | 17.8% |
| Standard Deviation (Population) | 2.2% | 17.5% |
Similar Demographics by Unemployment
Demographics Similar to Immigrants from Scotland by Unemployment
In terms of unemployment, the demographic groups most similar to Immigrants from Scotland are Immigrants from South Central Asia (4.9%, a difference of 0.010%), French Canadian (4.9%, a difference of 0.030%), Immigrants from Belgium (4.9%, a difference of 0.19%), White/Caucasian (4.9%, a difference of 0.20%), and Immigrants from Taiwan (4.8%, a difference of 0.22%).
| Demographics | Rating | Rank | Unemployment |
| Immigrants | Bosnia and Herzegovina | 99.7 /100 | #41 | Exceptional 4.8% |
| Filipinos | 99.5 /100 | #42 | Exceptional 4.8% |
| Yugoslavians | 99.5 /100 | #43 | Exceptional 4.8% |
| Austrians | 99.5 /100 | #44 | Exceptional 4.8% |
| French | 99.5 /100 | #45 | Exceptional 4.8% |
| Immigrants | Nepal | 99.4 /100 | #46 | Exceptional 4.8% |
| Immigrants | Taiwan | 99.4 /100 | #47 | Exceptional 4.8% |
| Immigrants | Scotland | 99.3 /100 | #48 | Exceptional 4.9% |
| Immigrants | South Central Asia | 99.3 /100 | #49 | Exceptional 4.9% |
| French Canadians | 99.3 /100 | #50 | Exceptional 4.9% |
| Immigrants | Belgium | 99.2 /100 | #51 | Exceptional 4.9% |
| Whites/Caucasians | 99.2 /100 | #52 | Exceptional 4.9% |
| Immigrants | Zimbabwe | 99.2 /100 | #53 | Exceptional 4.9% |
| Eastern Europeans | 99.2 /100 | #54 | Exceptional 4.9% |
| Australians | 99.2 /100 | #55 | Exceptional 4.9% |
Demographics Similar to Tohono O'odham by Unemployment
In terms of unemployment, the demographic groups most similar to Tohono O'odham are Hopi (8.9%, a difference of 0.45%), Yuman (9.1%, a difference of 2.1%), Puerto Rican (8.4%, a difference of 5.4%), Navajo (8.4%, a difference of 6.3%), and Pima (8.2%, a difference of 7.9%).
| Demographics | Rating | Rank | Unemployment |
| Immigrants | Dominican Republic | 0.0 /100 | #333 | Tragic 7.4% |
| Apache | 0.0 /100 | #334 | Tragic 7.4% |
| Alaskan Athabascans | 0.0 /100 | #335 | Tragic 7.7% |
| Immigrants | Yemen | 0.0 /100 | #336 | Tragic 7.7% |
| Cheyenne | 0.0 /100 | #337 | Tragic 8.0% |
| Pima | 0.0 /100 | #338 | Tragic 8.2% |
| Navajo | 0.0 /100 | #339 | Tragic 8.4% |
| Puerto Ricans | 0.0 /100 | #340 | Tragic 8.4% |
| Tohono O'odham | 0.0 /100 | #341 | Tragic 8.9% |
| Hopi | 0.0 /100 | #342 | Tragic 8.9% |
| Yuman | 0.0 /100 | #343 | Tragic 9.1% |
| Arapaho | 0.0 /100 | #344 | Tragic 9.8% |
| Inupiat | 0.0 /100 | #345 | Tragic 10.1% |
| Crow | 0.0 /100 | #346 | Tragic 11.1% |
| Yup'ik | 0.0 /100 | #347 | Tragic 13.6% |