Immigrants from Belarus vs Tohono O'odham Unemployment
COMPARE
Immigrants from Belarus
Tohono O'odham
Unemployment
Unemployment Comparison
Immigrants from Belarus
Tohono O'odham
5.3%
UNEMPLOYMENT
35.6/ 100
METRIC RATING
189th/ 347
METRIC RANK
8.9%
UNEMPLOYMENT
0.0/ 100
METRIC RATING
341st/ 347
METRIC RANK
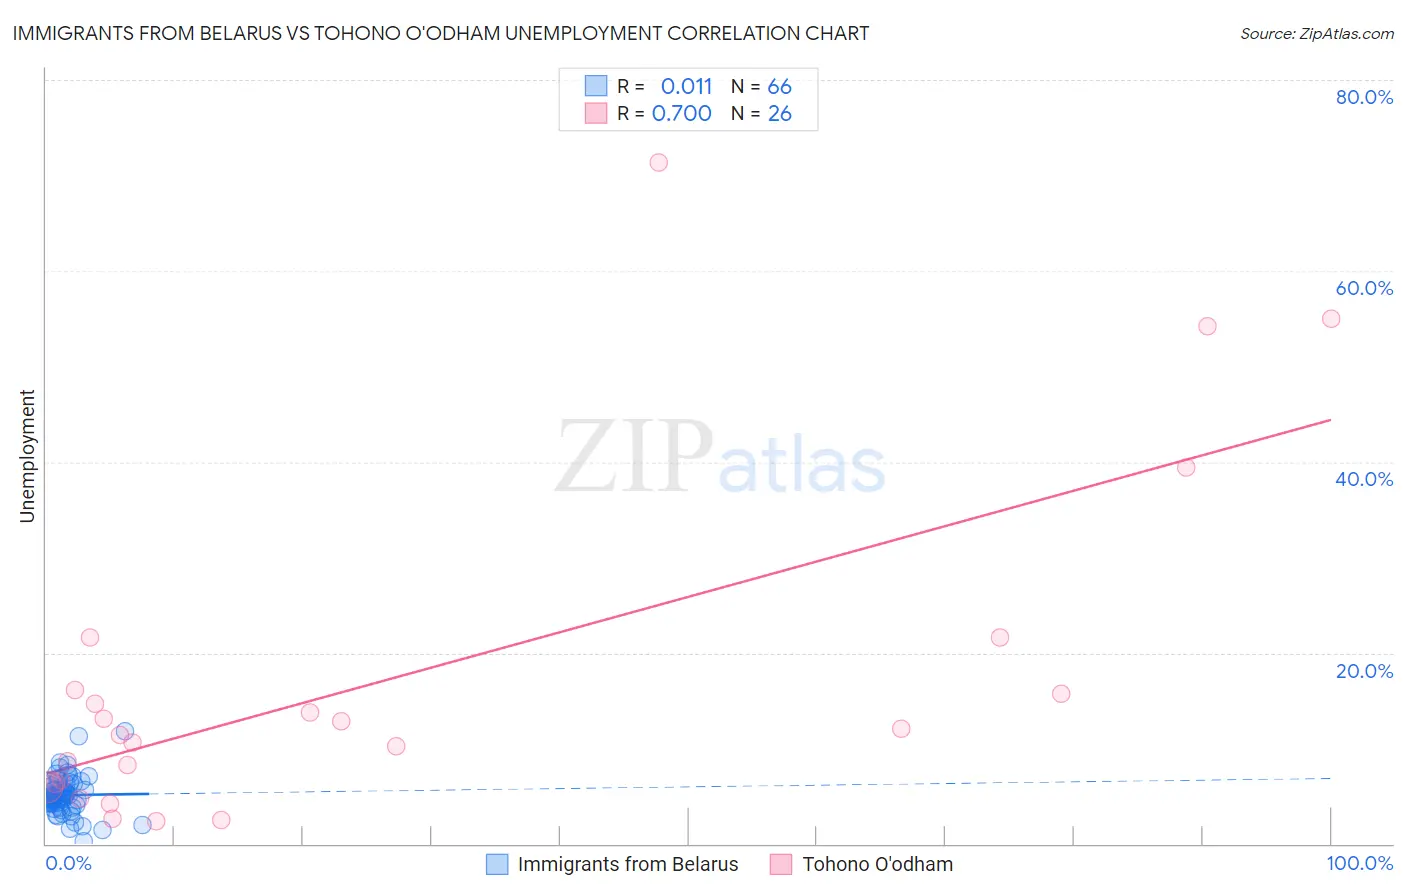
Immigrants from Belarus vs Tohono O'odham Unemployment Correlation Chart
The statistical analysis conducted on geographies consisting of 150,154,457 people shows no correlation between the proportion of Immigrants from Belarus and unemployment in the United States with a correlation coefficient (R) of 0.011 and weighted average of 5.3%. Similarly, the statistical analysis conducted on geographies consisting of 58,714,465 people shows a strong positive correlation between the proportion of Tohono O'odham and unemployment in the United States with a correlation coefficient (R) of 0.700 and weighted average of 8.9%, a difference of 67.3%.
Unemployment Correlation Summary
| Measurement | Immigrants from Belarus | Tohono O'odham |
| Minimum | 0.30% | 2.4% |
| Maximum | 11.8% | 71.4% |
| Range | 11.5% | 69.0% |
| Mean | 5.1% | 17.2% |
| Median | 4.9% | 11.8% |
| Interquartile 25% (IQ1) | 4.2% | 6.4% |
| Interquartile 75% (IQ3) | 6.3% | 16.1% |
| Interquartile Range (IQR) | 2.1% | 9.7% |
| Standard Deviation (Sample) | 2.0% | 17.8% |
| Standard Deviation (Population) | 2.0% | 17.5% |
Similar Demographics by Unemployment
Demographics Similar to Immigrants from Belarus by Unemployment
In terms of unemployment, the demographic groups most similar to Immigrants from Belarus are Arab (5.3%, a difference of 0.020%), Alsatian (5.3%, a difference of 0.090%), Somali (5.3%, a difference of 0.11%), South American (5.3%, a difference of 0.11%), and Costa Rican (5.3%, a difference of 0.12%).
| Demographics | Rating | Rank | Unemployment |
| Spaniards | 42.2 /100 | #182 | Average 5.3% |
| Brazilians | 40.2 /100 | #183 | Average 5.3% |
| Assyrians/Chaldeans/Syriacs | 39.2 /100 | #184 | Fair 5.3% |
| Immigrants | Thailand | 38.9 /100 | #185 | Fair 5.3% |
| Immigrants | Uganda | 37.8 /100 | #186 | Fair 5.3% |
| Costa Ricans | 37.4 /100 | #187 | Fair 5.3% |
| Alsatians | 37.0 /100 | #188 | Fair 5.3% |
| Immigrants | Belarus | 35.6 /100 | #189 | Fair 5.3% |
| Arabs | 35.3 /100 | #190 | Fair 5.3% |
| Somalis | 34.0 /100 | #191 | Fair 5.3% |
| South Americans | 33.9 /100 | #192 | Fair 5.3% |
| Immigrants | Somalia | 33.8 /100 | #193 | Fair 5.3% |
| Immigrants | Laos | 30.9 /100 | #194 | Fair 5.3% |
| Immigrants | Southern Europe | 30.9 /100 | #195 | Fair 5.3% |
| Peruvians | 29.9 /100 | #196 | Fair 5.3% |
Demographics Similar to Tohono O'odham by Unemployment
In terms of unemployment, the demographic groups most similar to Tohono O'odham are Hopi (8.9%, a difference of 0.45%), Yuman (9.1%, a difference of 2.1%), Puerto Rican (8.4%, a difference of 5.4%), Navajo (8.4%, a difference of 6.3%), and Pima (8.2%, a difference of 7.9%).
| Demographics | Rating | Rank | Unemployment |
| Immigrants | Dominican Republic | 0.0 /100 | #333 | Tragic 7.4% |
| Apache | 0.0 /100 | #334 | Tragic 7.4% |
| Alaskan Athabascans | 0.0 /100 | #335 | Tragic 7.7% |
| Immigrants | Yemen | 0.0 /100 | #336 | Tragic 7.7% |
| Cheyenne | 0.0 /100 | #337 | Tragic 8.0% |
| Pima | 0.0 /100 | #338 | Tragic 8.2% |
| Navajo | 0.0 /100 | #339 | Tragic 8.4% |
| Puerto Ricans | 0.0 /100 | #340 | Tragic 8.4% |
| Tohono O'odham | 0.0 /100 | #341 | Tragic 8.9% |
| Hopi | 0.0 /100 | #342 | Tragic 8.9% |
| Yuman | 0.0 /100 | #343 | Tragic 9.1% |
| Arapaho | 0.0 /100 | #344 | Tragic 9.8% |
| Inupiat | 0.0 /100 | #345 | Tragic 10.1% |
| Crow | 0.0 /100 | #346 | Tragic 11.1% |
| Yup'ik | 0.0 /100 | #347 | Tragic 13.6% |