Yugoslavian vs Tohono O'odham Unemployment
COMPARE
Yugoslavian
Tohono O'odham
Unemployment
Unemployment Comparison
Yugoslavians
Tohono O'odham
4.8%
UNEMPLOYMENT
99.5/ 100
METRIC RATING
43rd/ 347
METRIC RANK
8.9%
UNEMPLOYMENT
0.0/ 100
METRIC RATING
341st/ 347
METRIC RANK
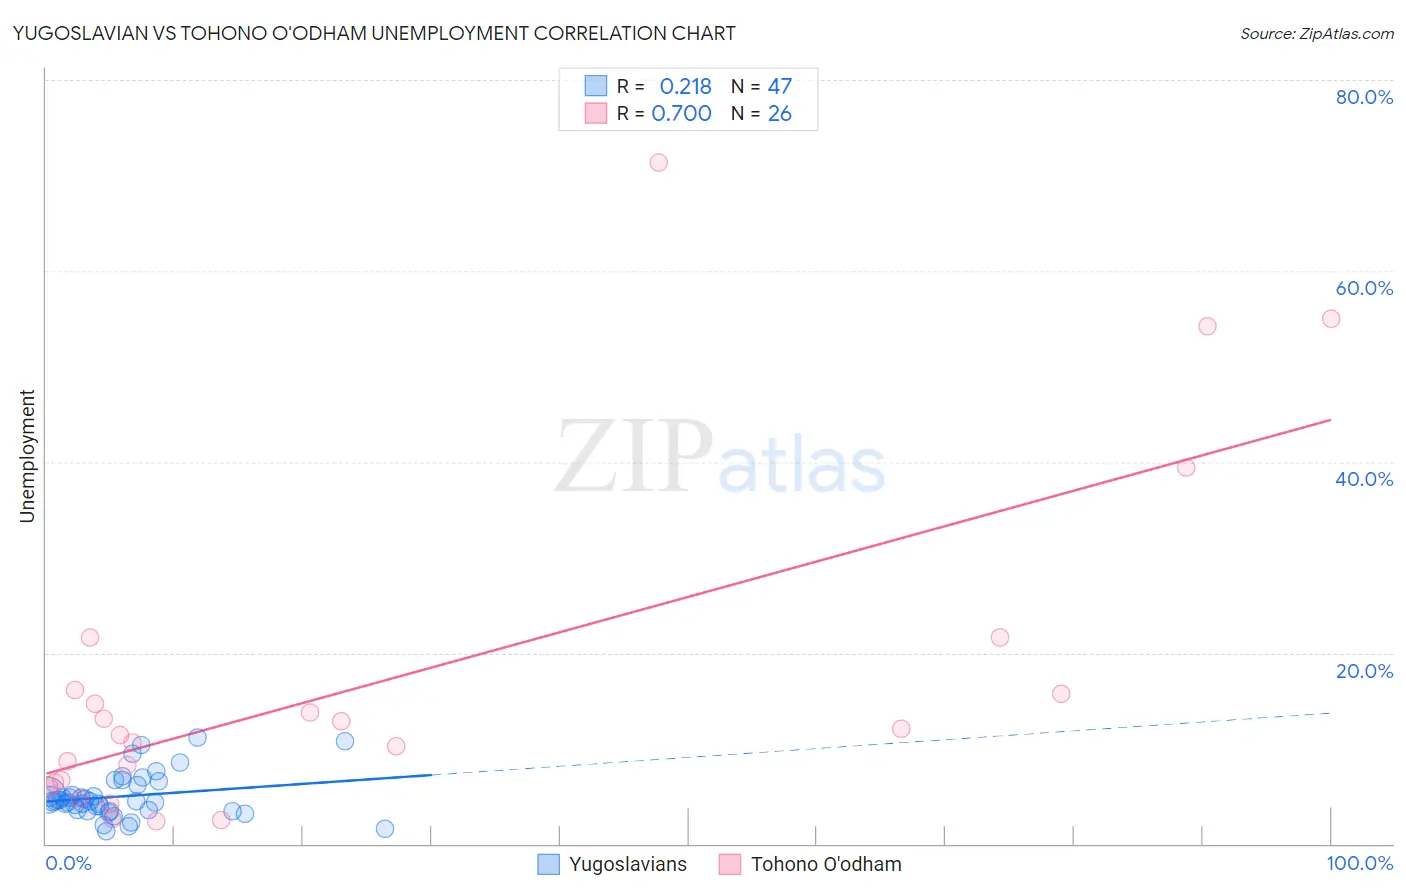
Yugoslavian vs Tohono O'odham Unemployment Correlation Chart
The statistical analysis conducted on geographies consisting of 285,527,553 people shows a weak positive correlation between the proportion of Yugoslavians and unemployment in the United States with a correlation coefficient (R) of 0.218 and weighted average of 4.8%. Similarly, the statistical analysis conducted on geographies consisting of 58,714,465 people shows a strong positive correlation between the proportion of Tohono O'odham and unemployment in the United States with a correlation coefficient (R) of 0.700 and weighted average of 8.9%, a difference of 83.7%.
Unemployment Correlation Summary
| Measurement | Yugoslavian | Tohono O'odham |
| Minimum | 1.3% | 2.4% |
| Maximum | 11.2% | 71.4% |
| Range | 9.8% | 69.0% |
| Mean | 5.0% | 17.2% |
| Median | 4.5% | 11.8% |
| Interquartile 25% (IQ1) | 3.5% | 6.4% |
| Interquartile 75% (IQ3) | 6.1% | 16.1% |
| Interquartile Range (IQR) | 2.6% | 9.7% |
| Standard Deviation (Sample) | 2.3% | 17.8% |
| Standard Deviation (Population) | 2.3% | 17.5% |
Similar Demographics by Unemployment
Demographics Similar to Yugoslavians by Unemployment
In terms of unemployment, the demographic groups most similar to Yugoslavians are Austrian (4.8%, a difference of 0.060%), French (4.8%, a difference of 0.11%), Filipino (4.8%, a difference of 0.20%), Immigrants from Nepal (4.8%, a difference of 0.28%), and Immigrants from Taiwan (4.8%, a difference of 0.30%).
| Demographics | Rating | Rank | Unemployment |
| Tongans | 99.7 /100 | #36 | Exceptional 4.8% |
| Czechoslovakians | 99.7 /100 | #37 | Exceptional 4.8% |
| Bolivians | 99.7 /100 | #38 | Exceptional 4.8% |
| Lithuanians | 99.7 /100 | #39 | Exceptional 4.8% |
| Northern Europeans | 99.7 /100 | #40 | Exceptional 4.8% |
| Immigrants | Bosnia and Herzegovina | 99.7 /100 | #41 | Exceptional 4.8% |
| Filipinos | 99.5 /100 | #42 | Exceptional 4.8% |
| Yugoslavians | 99.5 /100 | #43 | Exceptional 4.8% |
| Austrians | 99.5 /100 | #44 | Exceptional 4.8% |
| French | 99.5 /100 | #45 | Exceptional 4.8% |
| Immigrants | Nepal | 99.4 /100 | #46 | Exceptional 4.8% |
| Immigrants | Taiwan | 99.4 /100 | #47 | Exceptional 4.8% |
| Immigrants | Scotland | 99.3 /100 | #48 | Exceptional 4.9% |
| Immigrants | South Central Asia | 99.3 /100 | #49 | Exceptional 4.9% |
| French Canadians | 99.3 /100 | #50 | Exceptional 4.9% |
Demographics Similar to Tohono O'odham by Unemployment
In terms of unemployment, the demographic groups most similar to Tohono O'odham are Hopi (8.9%, a difference of 0.45%), Yuman (9.1%, a difference of 2.1%), Puerto Rican (8.4%, a difference of 5.4%), Navajo (8.4%, a difference of 6.3%), and Pima (8.2%, a difference of 7.9%).
| Demographics | Rating | Rank | Unemployment |
| Immigrants | Dominican Republic | 0.0 /100 | #333 | Tragic 7.4% |
| Apache | 0.0 /100 | #334 | Tragic 7.4% |
| Alaskan Athabascans | 0.0 /100 | #335 | Tragic 7.7% |
| Immigrants | Yemen | 0.0 /100 | #336 | Tragic 7.7% |
| Cheyenne | 0.0 /100 | #337 | Tragic 8.0% |
| Pima | 0.0 /100 | #338 | Tragic 8.2% |
| Navajo | 0.0 /100 | #339 | Tragic 8.4% |
| Puerto Ricans | 0.0 /100 | #340 | Tragic 8.4% |
| Tohono O'odham | 0.0 /100 | #341 | Tragic 8.9% |
| Hopi | 0.0 /100 | #342 | Tragic 8.9% |
| Yuman | 0.0 /100 | #343 | Tragic 9.1% |
| Arapaho | 0.0 /100 | #344 | Tragic 9.8% |
| Inupiat | 0.0 /100 | #345 | Tragic 10.1% |
| Crow | 0.0 /100 | #346 | Tragic 11.1% |
| Yup'ik | 0.0 /100 | #347 | Tragic 13.6% |