Immigrants from Zaire vs Chickasaw Female Unemployment
COMPARE
Immigrants from Zaire
Chickasaw
Female Unemployment
Female Unemployment Comparison
Immigrants from Zaire
Chickasaw
5.0%
FEMALE UNEMPLOYMENT
95.2/ 100
METRIC RATING
99th/ 347
METRIC RANK
5.1%
FEMALE UNEMPLOYMENT
83.2/ 100
METRIC RATING
138th/ 347
METRIC RANK
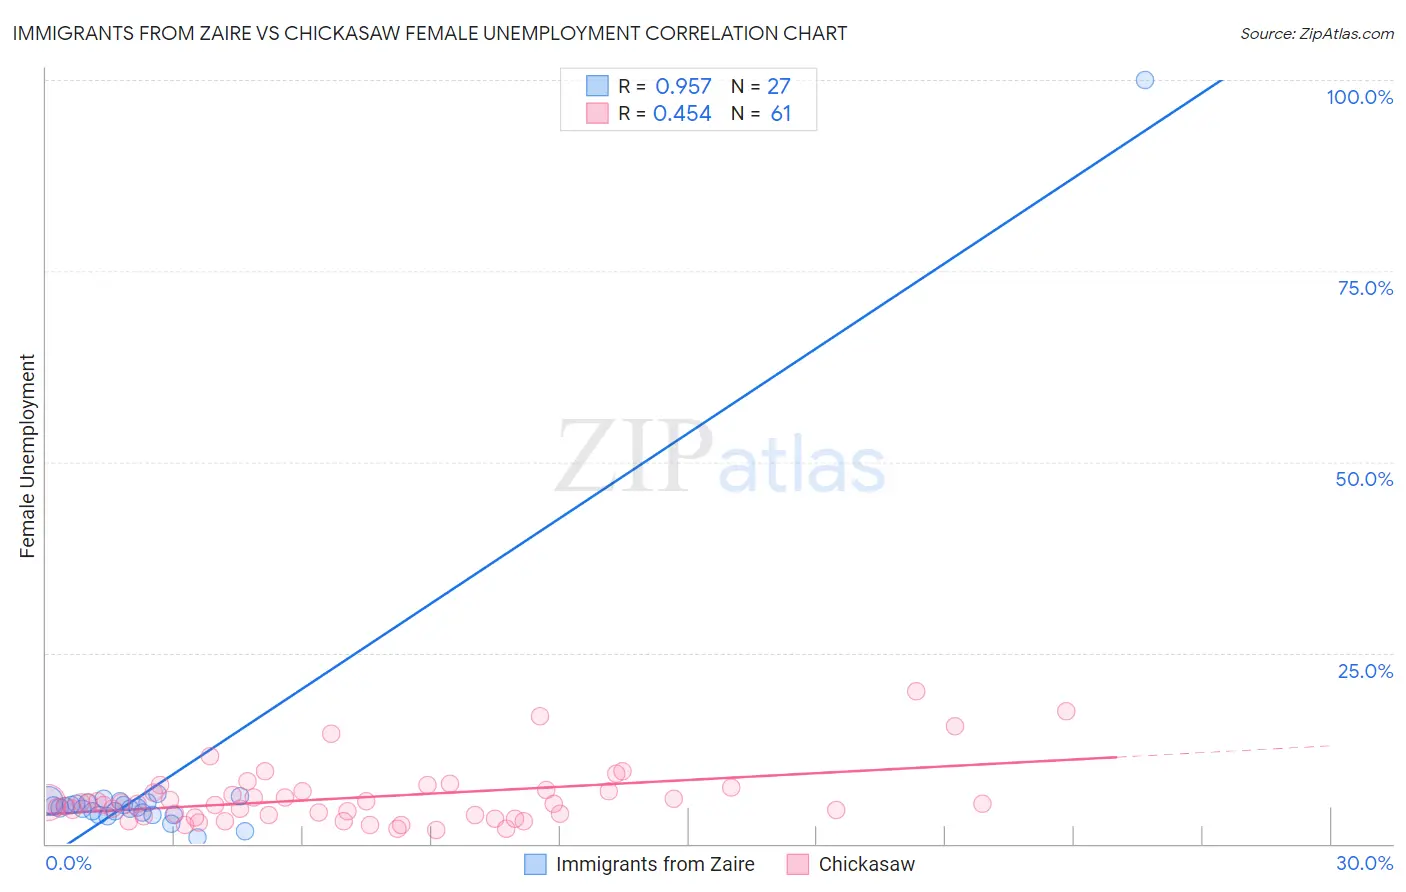
Immigrants from Zaire vs Chickasaw Female Unemployment Correlation Chart
The statistical analysis conducted on geographies consisting of 107,156,067 people shows a perfect positive correlation between the proportion of Immigrants from Zaire and unemploymnet rate among females in the United States with a correlation coefficient (R) of 0.957 and weighted average of 5.0%. Similarly, the statistical analysis conducted on geographies consisting of 147,184,773 people shows a moderate positive correlation between the proportion of Chickasaw and unemploymnet rate among females in the United States with a correlation coefficient (R) of 0.454 and weighted average of 5.1%, a difference of 2.2%.
Female Unemployment Correlation Summary
| Measurement | Immigrants from Zaire | Chickasaw |
| Minimum | 0.80% | 1.8% |
| Maximum | 100.0% | 20.0% |
| Range | 99.2% | 18.2% |
| Mean | 8.0% | 6.1% |
| Median | 4.8% | 5.2% |
| Interquartile 25% (IQ1) | 3.8% | 3.7% |
| Interquartile 75% (IQ3) | 5.4% | 7.0% |
| Interquartile Range (IQR) | 1.6% | 3.3% |
| Standard Deviation (Sample) | 18.4% | 3.8% |
| Standard Deviation (Population) | 18.1% | 3.8% |
Similar Demographics by Female Unemployment
Demographics Similar to Immigrants from Zaire by Female Unemployment
In terms of female unemployment, the demographic groups most similar to Immigrants from Zaire are Immigrants from Somalia (5.0%, a difference of 0.010%), Immigrants from Kuwait (5.0%, a difference of 0.010%), Indonesian (5.0%, a difference of 0.020%), Immigrants from Czechoslovakia (5.0%, a difference of 0.060%), and Immigrants from South Central Asia (5.0%, a difference of 0.12%).
| Demographics | Rating | Rank | Female Unemployment |
| Romanians | 95.9 /100 | #92 | Exceptional 5.0% |
| Immigrants | Austria | 95.7 /100 | #93 | Exceptional 5.0% |
| Immigrants | Malaysia | 95.7 /100 | #94 | Exceptional 5.0% |
| Burmese | 95.6 /100 | #95 | Exceptional 5.0% |
| Immigrants | South Central Asia | 95.5 /100 | #96 | Exceptional 5.0% |
| Immigrants | Somalia | 95.2 /100 | #97 | Exceptional 5.0% |
| Immigrants | Kuwait | 95.2 /100 | #98 | Exceptional 5.0% |
| Immigrants | Zaire | 95.2 /100 | #99 | Exceptional 5.0% |
| Indonesians | 95.1 /100 | #100 | Exceptional 5.0% |
| Immigrants | Czechoslovakia | 95.0 /100 | #101 | Exceptional 5.0% |
| Immigrants | Kenya | 94.8 /100 | #102 | Exceptional 5.0% |
| Somalis | 94.6 /100 | #103 | Exceptional 5.0% |
| Kenyans | 93.7 /100 | #104 | Exceptional 5.0% |
| Immigrants | England | 93.6 /100 | #105 | Exceptional 5.0% |
| Paraguayans | 93.2 /100 | #106 | Exceptional 5.1% |
Demographics Similar to Chickasaw by Female Unemployment
In terms of female unemployment, the demographic groups most similar to Chickasaw are Immigrants from Eastern Asia (5.1%, a difference of 0.020%), Pakistani (5.1%, a difference of 0.060%), Immigrants from France (5.1%, a difference of 0.060%), Indian (Asian) (5.1%, a difference of 0.11%), and Immigrants from Latvia (5.1%, a difference of 0.15%).
| Demographics | Rating | Rank | Female Unemployment |
| Immigrants | Ethiopia | 85.4 /100 | #131 | Excellent 5.1% |
| Immigrants | Sri Lanka | 85.0 /100 | #132 | Excellent 5.1% |
| Immigrants | Hong Kong | 84.8 /100 | #133 | Excellent 5.1% |
| Immigrants | Eritrea | 84.6 /100 | #134 | Excellent 5.1% |
| Immigrants | Latvia | 84.6 /100 | #135 | Excellent 5.1% |
| Indians (Asian) | 84.2 /100 | #136 | Excellent 5.1% |
| Pakistanis | 83.8 /100 | #137 | Excellent 5.1% |
| Chickasaw | 83.2 /100 | #138 | Excellent 5.1% |
| Immigrants | Eastern Asia | 83.0 /100 | #139 | Excellent 5.1% |
| Immigrants | France | 82.7 /100 | #140 | Excellent 5.1% |
| Immigrants | Eastern Europe | 81.5 /100 | #141 | Excellent 5.1% |
| Palestinians | 80.8 /100 | #142 | Excellent 5.1% |
| Immigrants | Kazakhstan | 80.7 /100 | #143 | Excellent 5.1% |
| Immigrants | Jordan | 80.4 /100 | #144 | Excellent 5.1% |
| Immigrants | Oceania | 79.5 /100 | #145 | Good 5.2% |